Vancouver Island Market Report Infographics
INFOGRAPHICS: November 2025 VIREB Vancouver Island Market Reports

CONTINUED STABILITY REFLECTS CONFIDENCE IN HOUSING MARKET
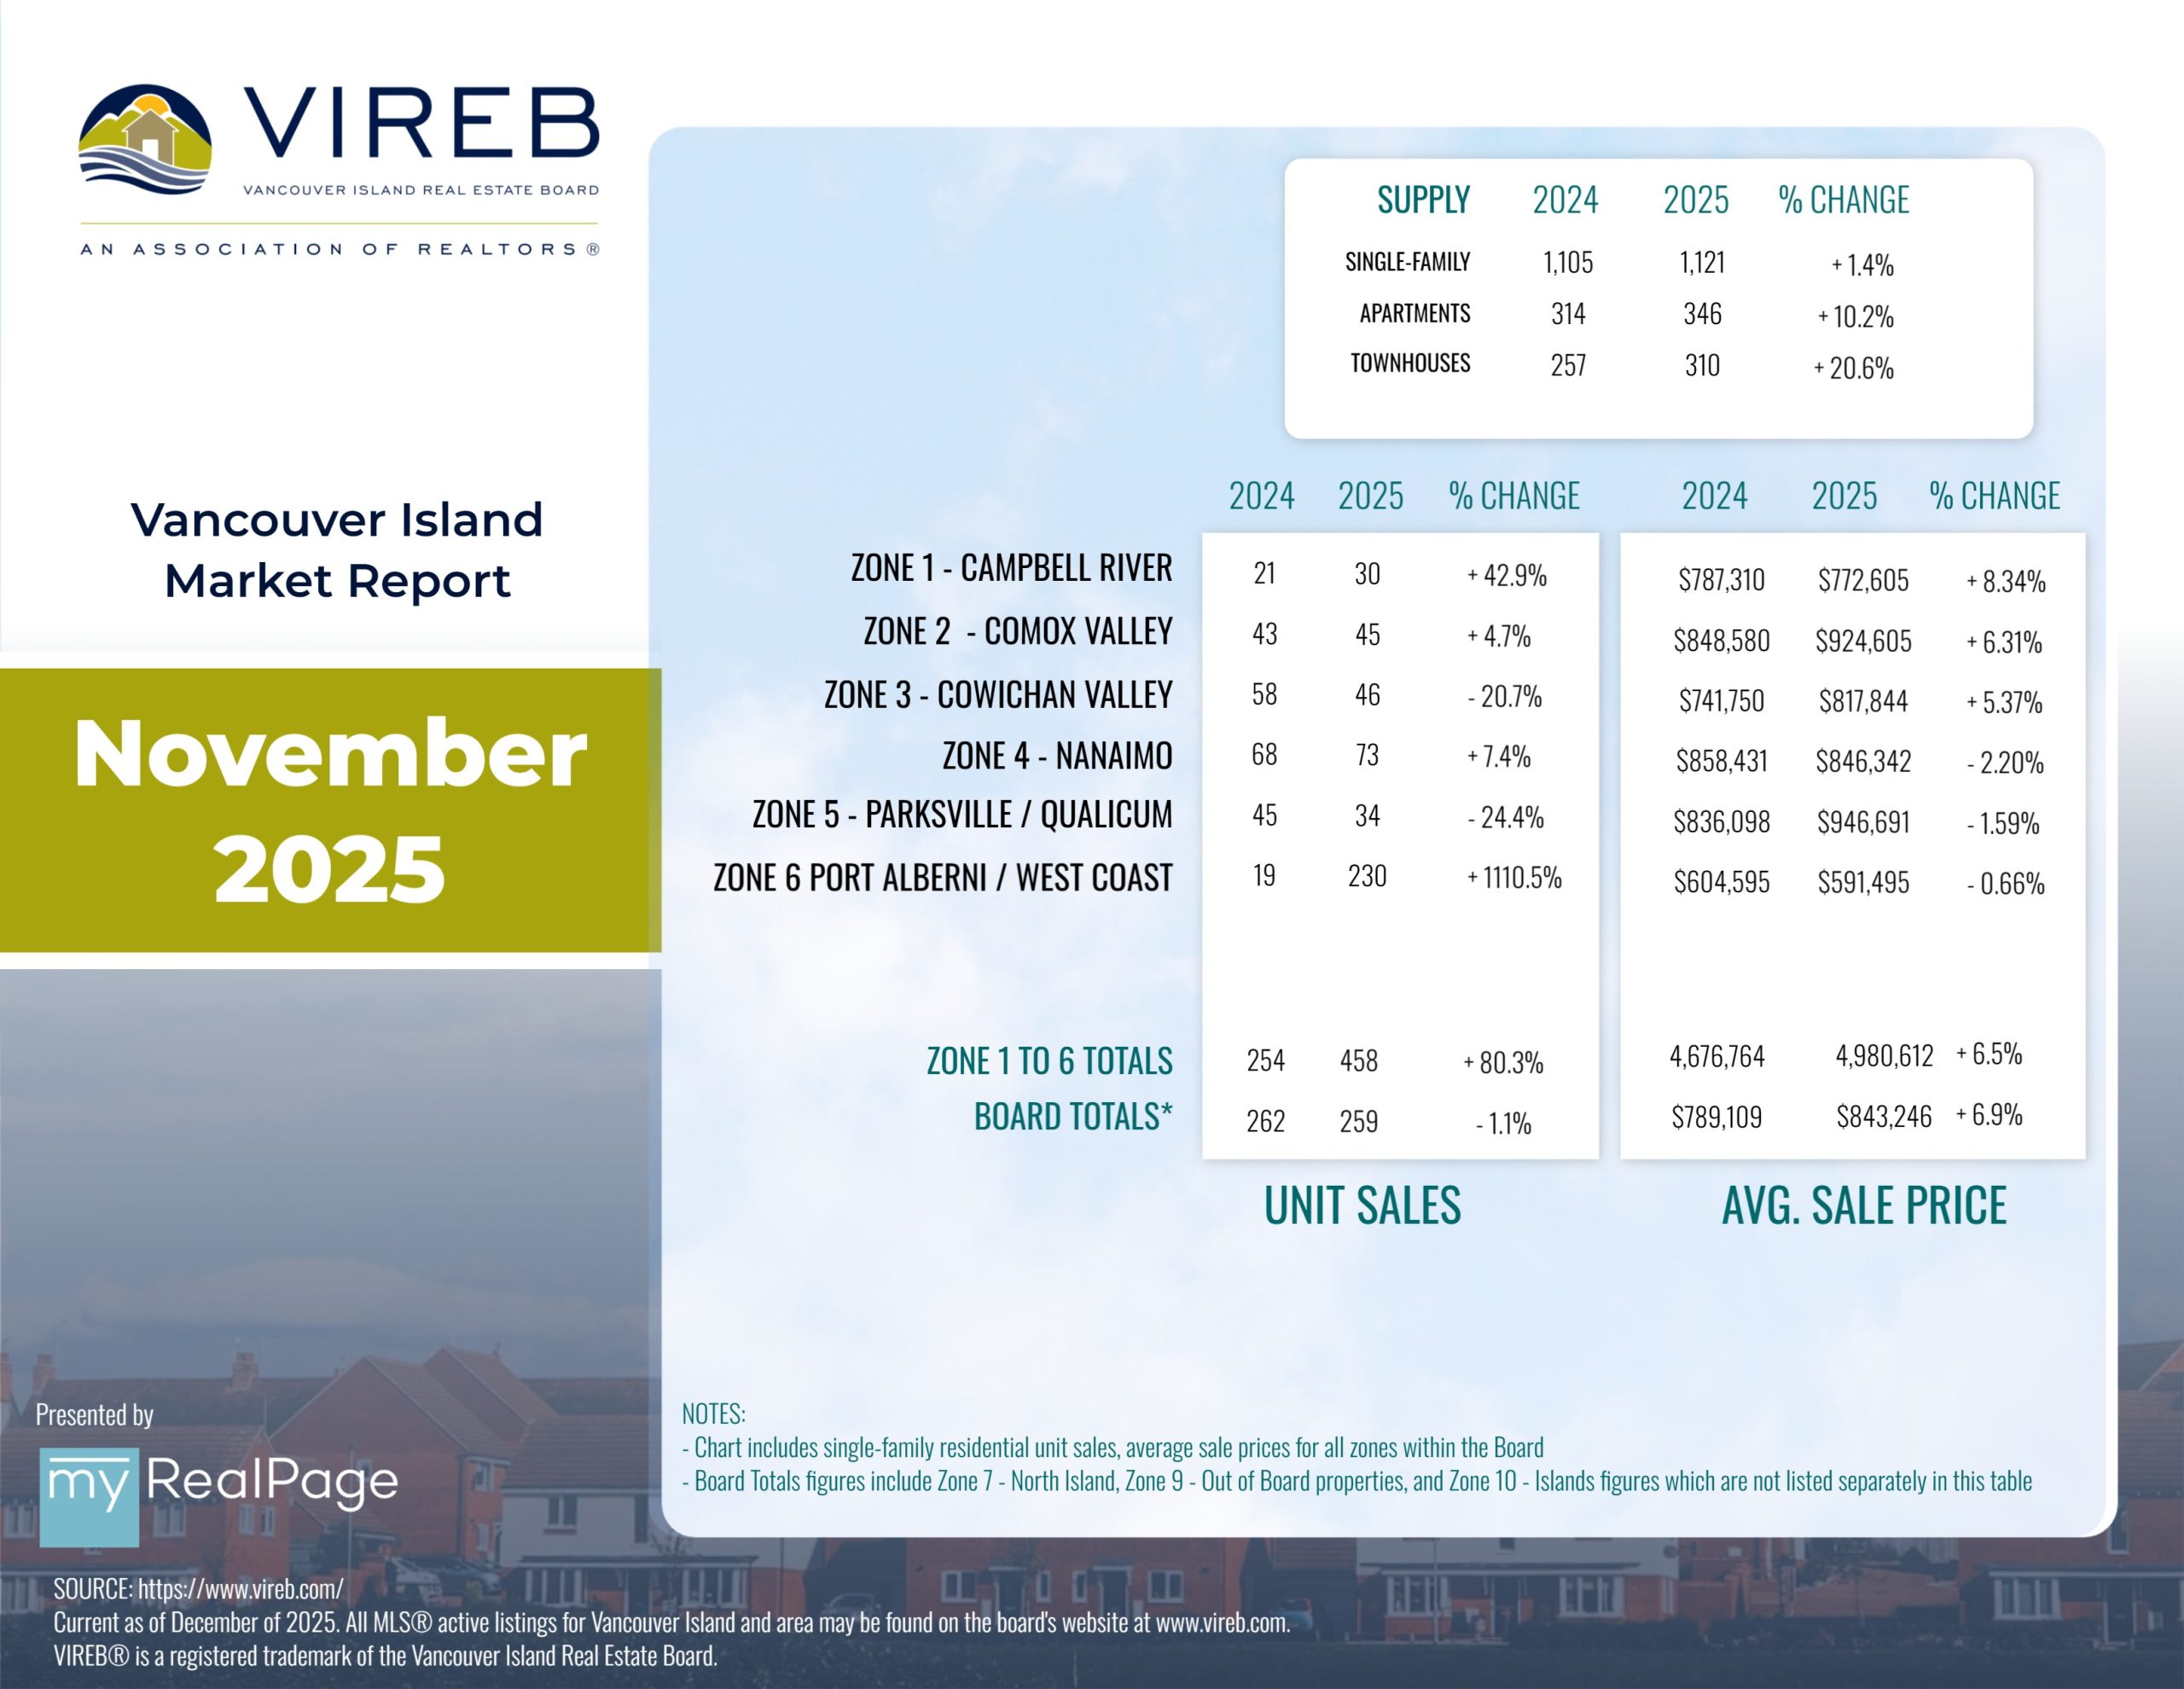
The Vancouver Island Real Estate Board (VIREB) recorded 513 unit sales (all property types) in November 2025, down eight per cent from one year ago. Year-over-year active listings (all property types) were 3,646, up five per cent from the previous year.
In the single-family category (excluding acreage and waterfront), 259 homes sold in November, down one per cent from one year ago and 18 per cent from October. Sales of condo apartments last month came in at 50, a decrease of 19 per cent year over year and a drop of 28 per cent from October. In the row/townhouse category, 53 units changed hands in November, down 29 per cent from one year ago and 32 per cent from October.
Active listings of single-family homes were 1,121 last month compared to 1,105 in November 2024. VIREB’s inventory of condo apartments was 346 in November, down from the 314 listings posted one year ago. There were 310 row/townhouses for sale last month compared to 257 in November 2024.
“VIREB’s housing market remains relatively stable, with sales sitting just below the ten-year average and conditions at the high end of balanced territory,” says VIREB CEO Jason Yochim. “Although sales of single-family homes, condo apartments, and row/townhouses dipped in November, that’s typical for this time of year as buyers and sellers slow down for the holidays.”
Read the full report on VIREB website!
The following data is a comparison between November 2025 and November 2024 numbers, and is current as of December of 2025. Click here to check out last month’s infographics.
You can also view all our VIREB infographics by clicking here.
Download Printable Version – November 2025 VIREB Market Report
INFOGRAPHICS: October 2025 VIREB Vancouver Island Market Reports

BALANCED CONDITIONS DEFINE LOCAL HOUSING MARKET THIS FALL
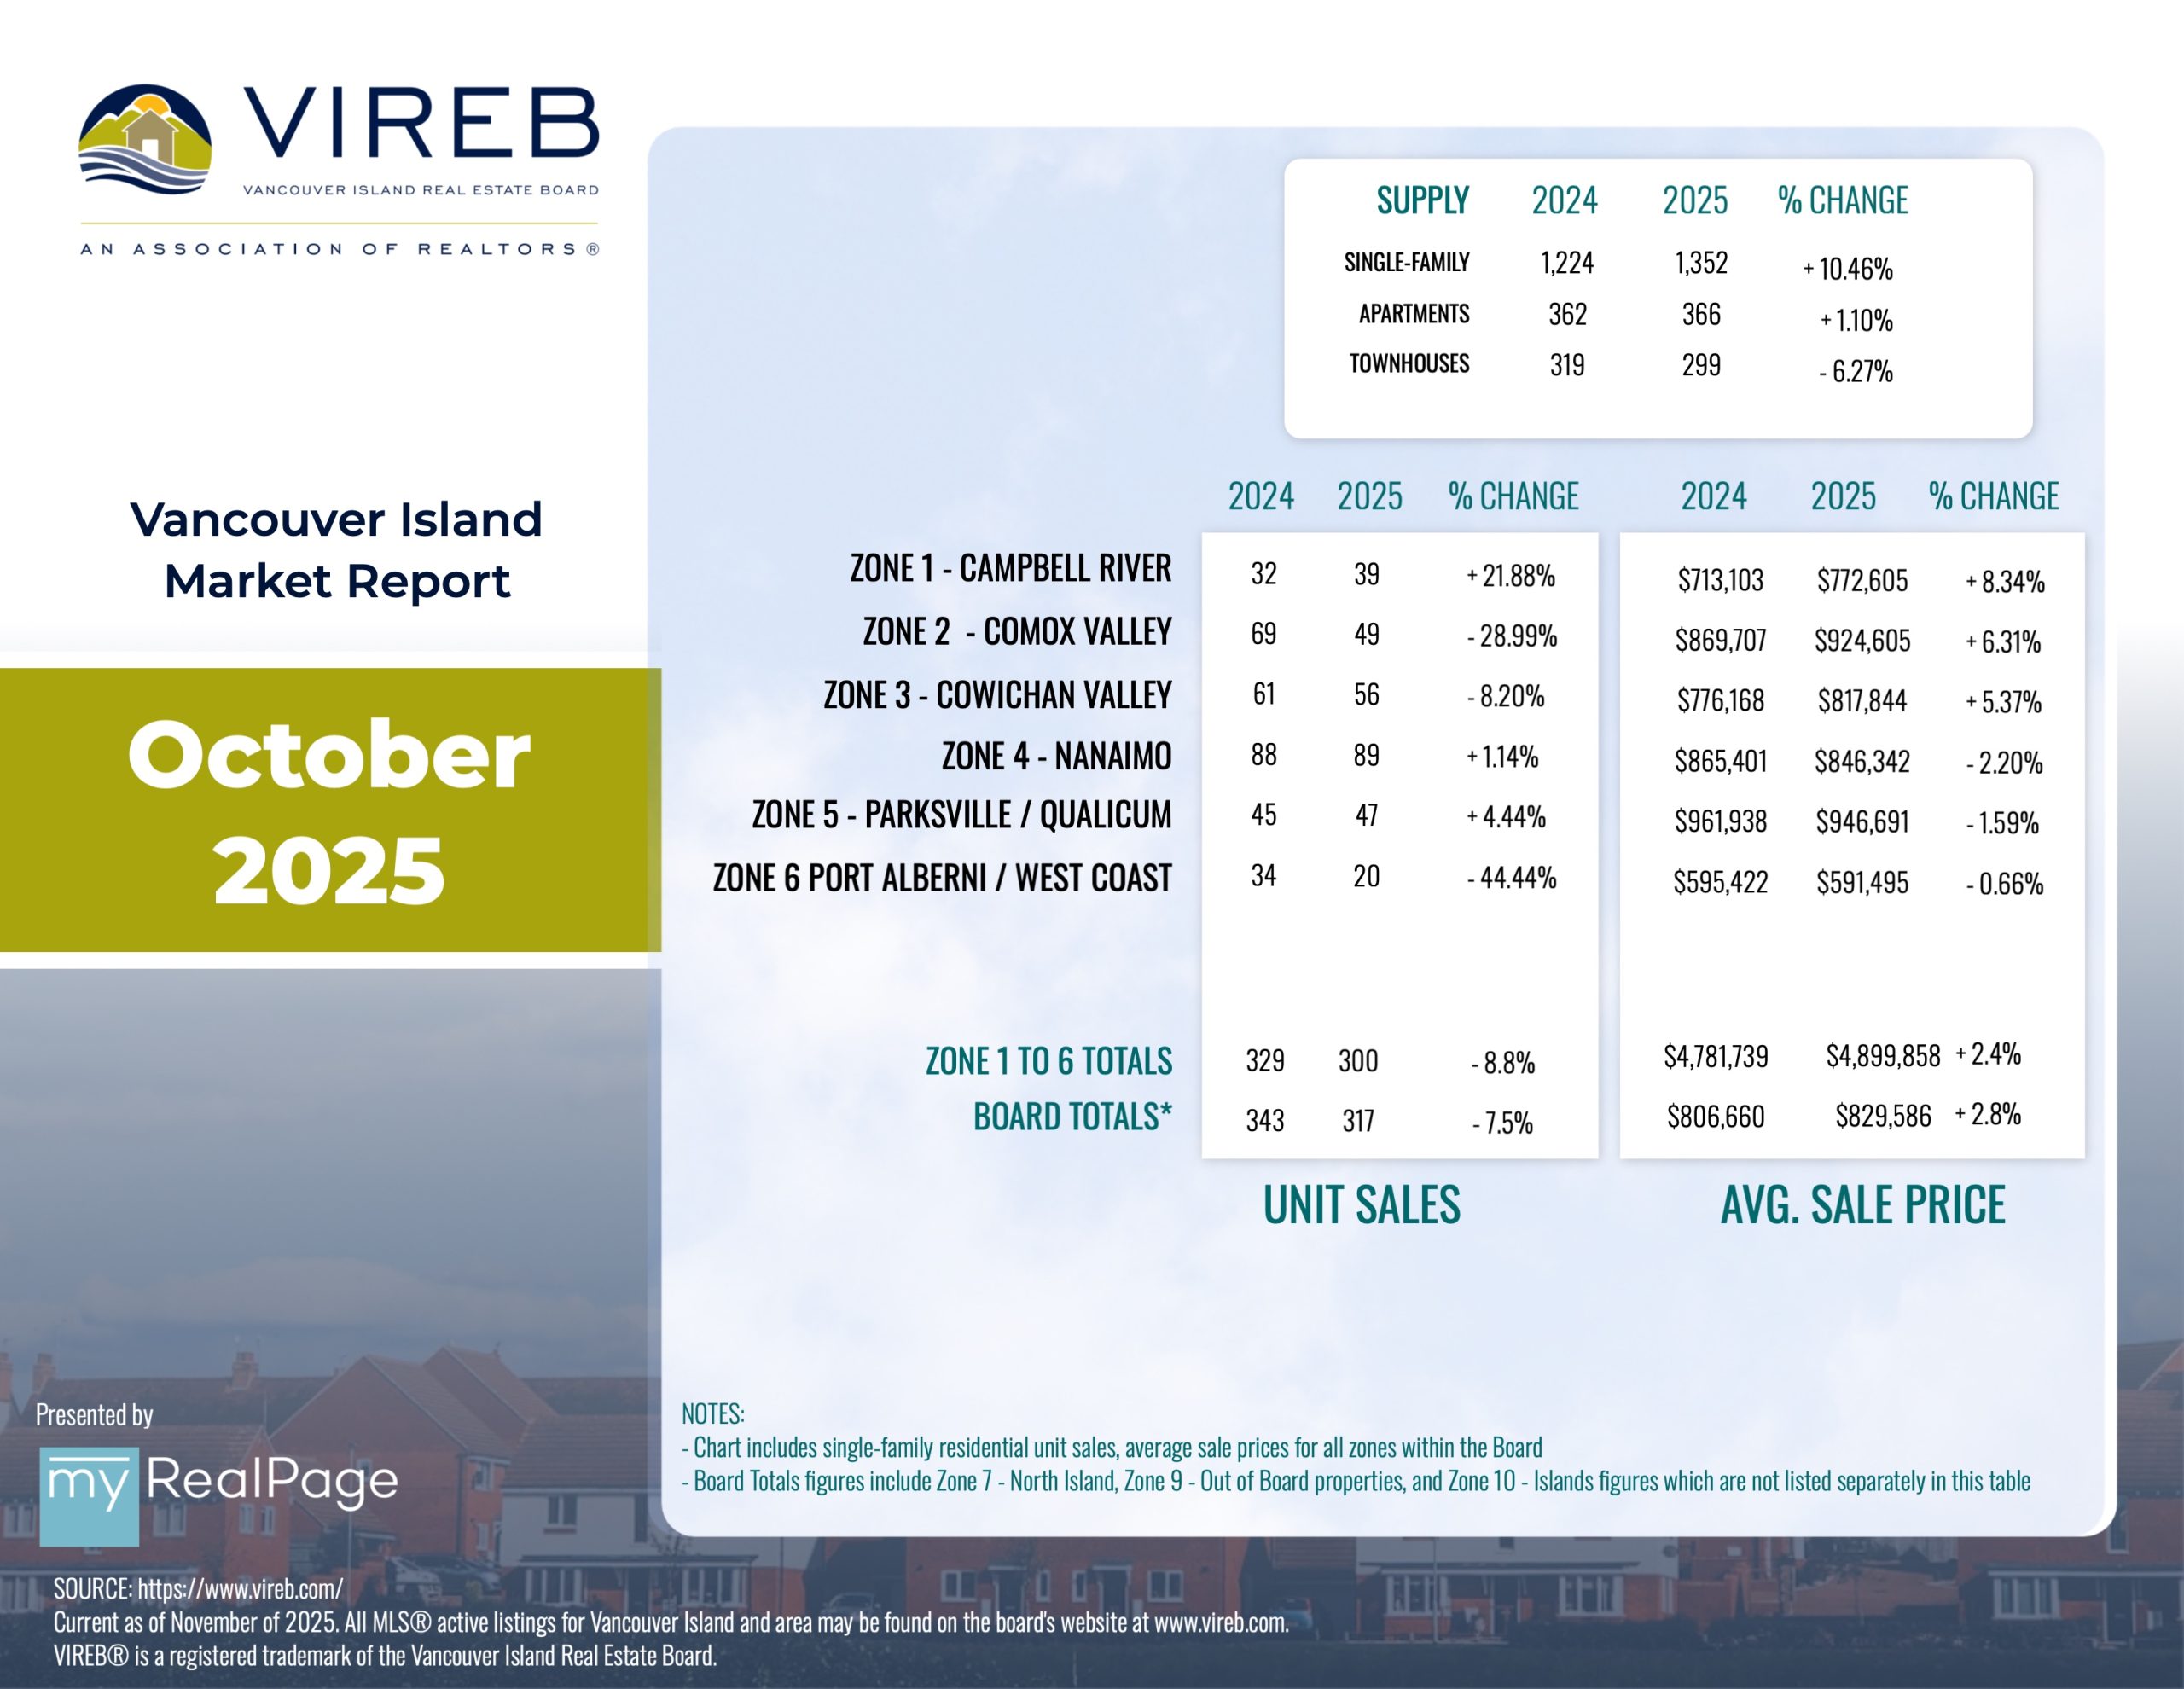
The Vancouver Island Real Estate Board (VIREB) recorded 649 unit sales (all property types) in October 2025, down nine per cent from one year ago. Year-over-year active listings (all property types) were 3,838, down four per cent from the previous year.
In the single-family category (excluding acreage and waterfront), 317 homes sold in October, down eight per cent from one year ago and up three per cent from September. Sales of condo apartments last month came in at 69, a decrease of 13 per cent year over year and up by 17 per cent from September. In the row/townhouse category, 78 units changed hands in October, down six per cent from one year ago and one per cent from September.
Active listings of single-family homes were 1,224 last month compared to 1,352 in October 2024. VIREB’s inventory of condo apartments was 362 in October, down from the 366 listings posted one year ago. There were 319 row/townhouses for sale last month compared to 299 in October 2024.
Read the full report on VIREB website!
The following data is a comparison between October 2025 and October 2024 numbers, and is current as of November of 2025. Click here to check out last month’s infographics.
You can also view all our VIREB infographics by clicking here.
Download Printable Version – October 2025 VIREB Market Report
INFOGRAPHICS: September 2025 VIREB Vancouver Island Market Reports

RESILIENT HOUSING MARKET CARRIES VIREB INTO THE FALL
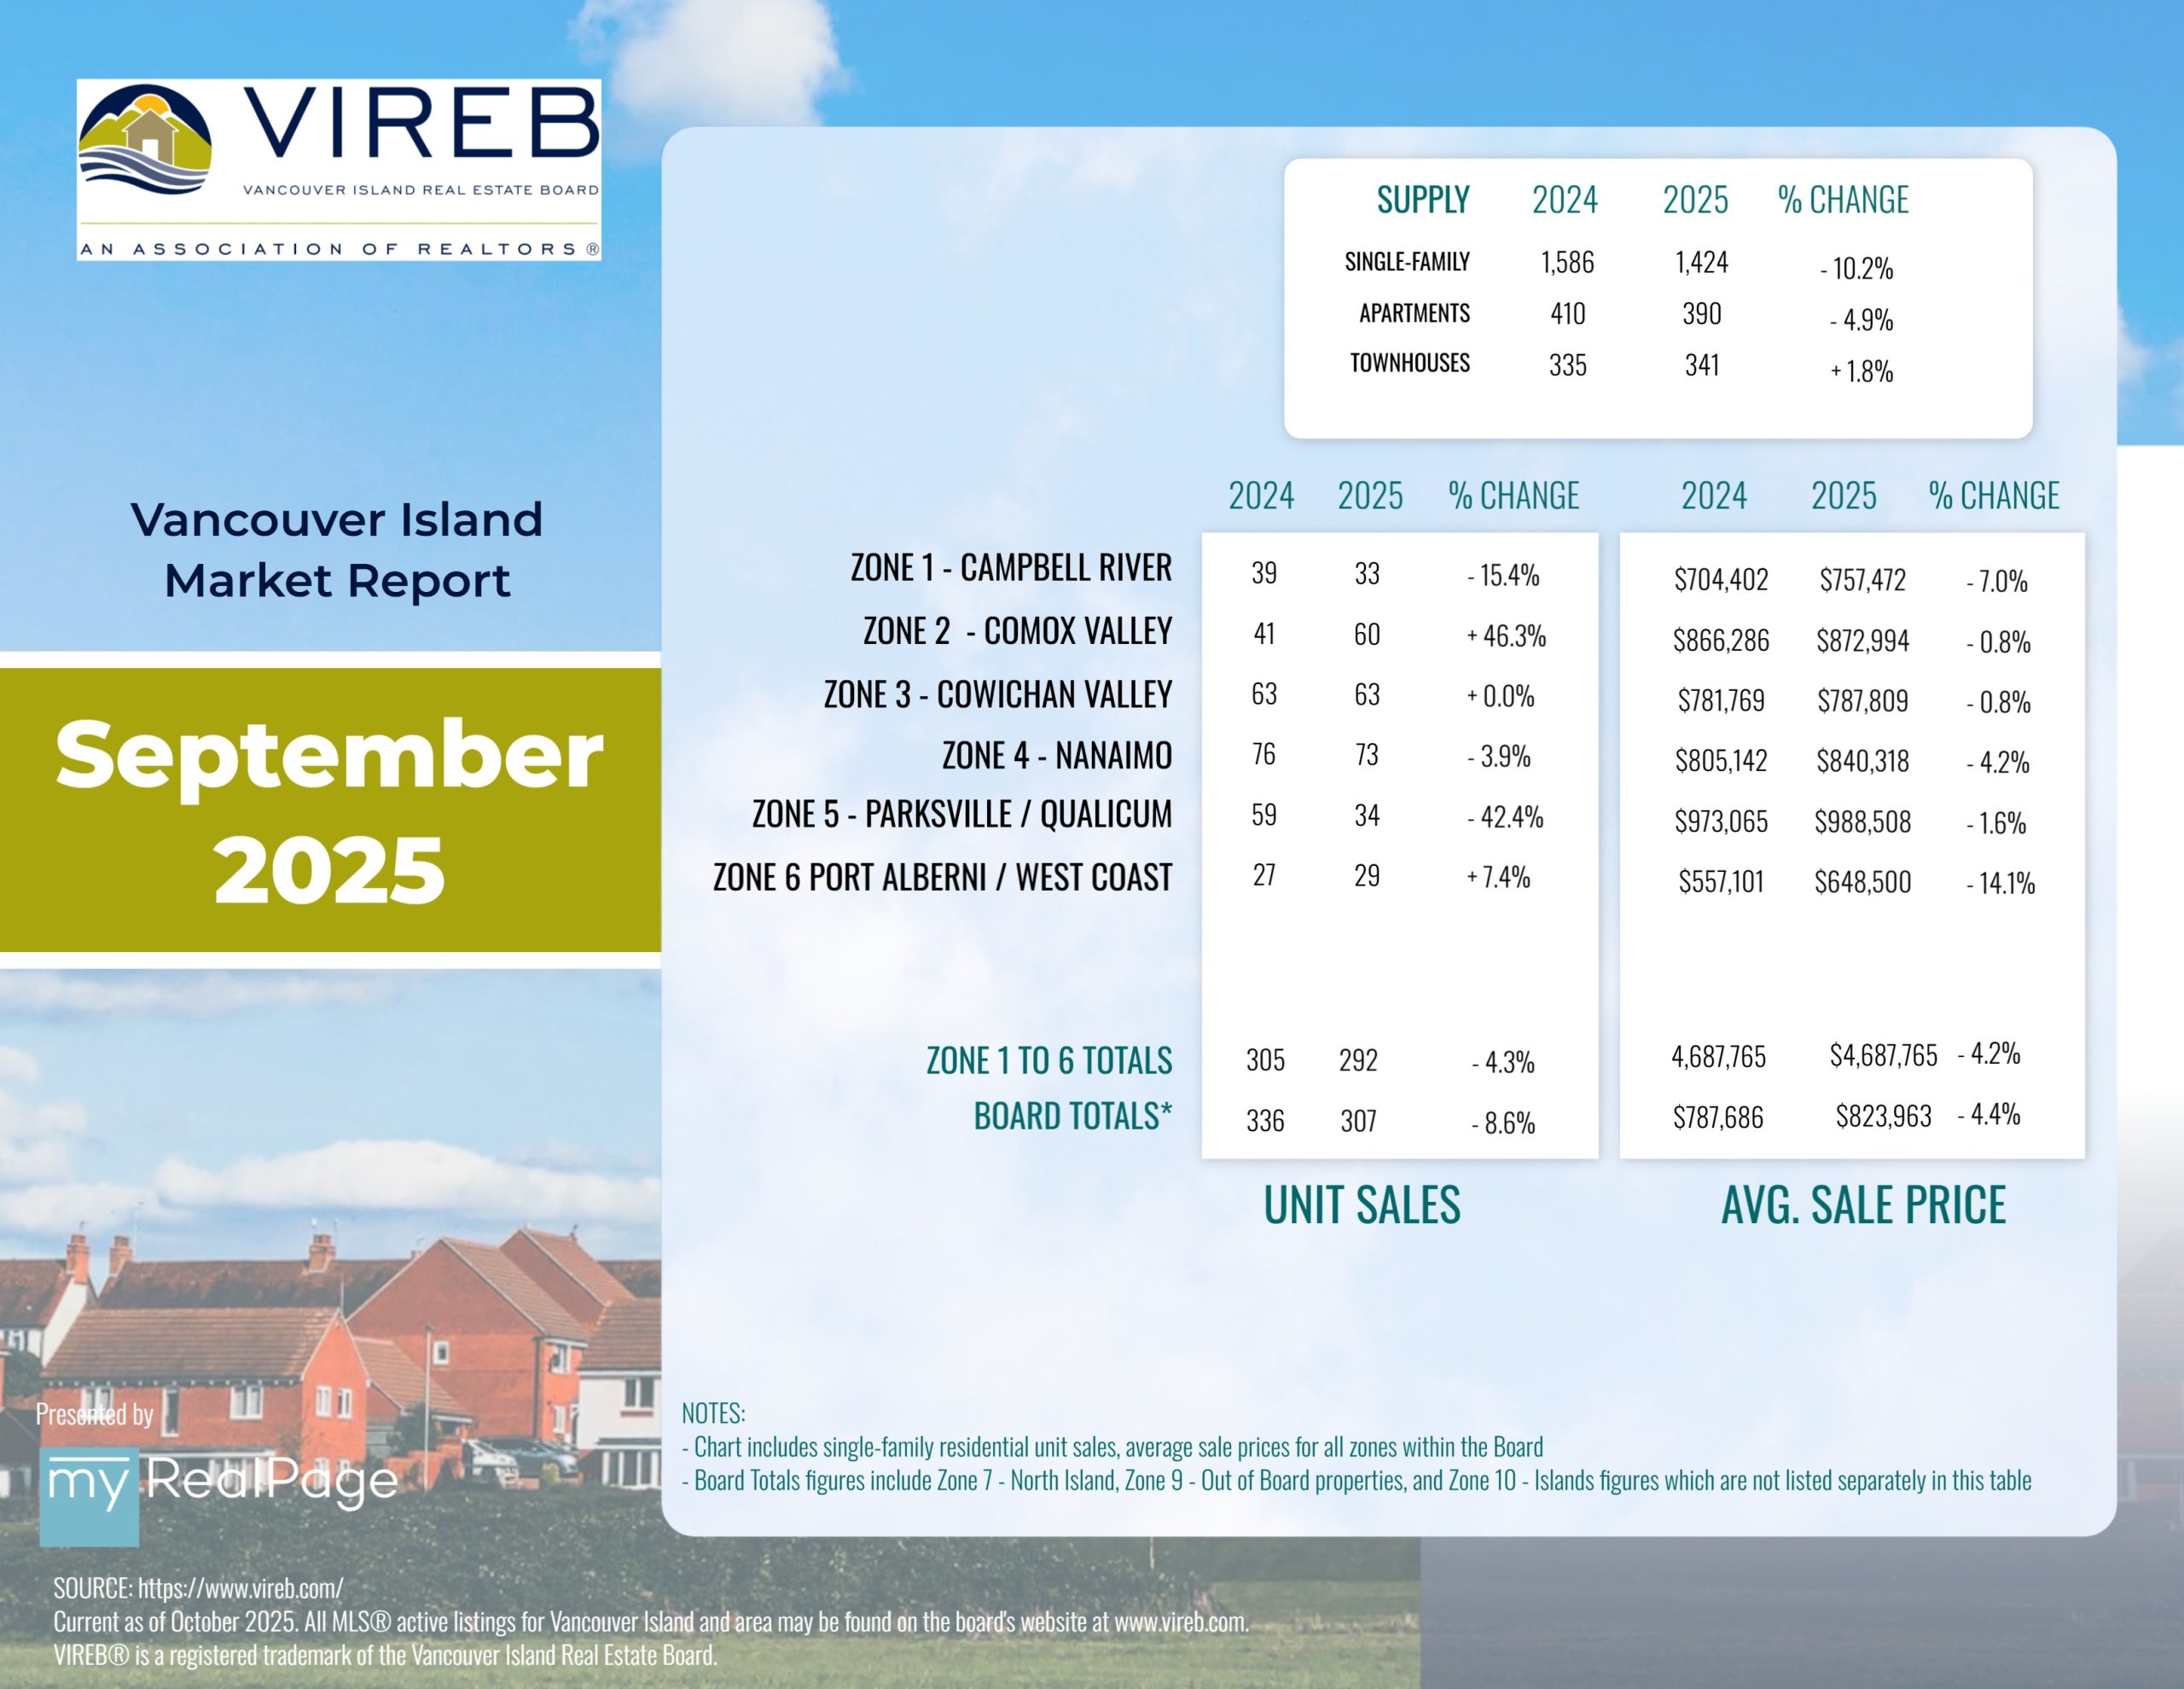
The Vancouver Island Real Estate Board (VIREB) recorded 653 unit sales (all property types) in September 2025, up three per cent from one year ago. Year-over-year active listings (all property types) were 4,293, down four per cent from the previous year.
In the single-family category (excluding acreage and waterfront), 307 homes sold in September, down four per cent from one year ago and nine per cent from August. Sales of condo apartments last month came in at 59, a decrease of 14 per cent year over year and a drop of 20 per cent from August. In the row/townhouse category, 79 units changed hands in September, down 13 per cent from one year ago and up 10 per cent from August.
Active listings of single-family homes were 1,424 last month compared to 1,586 in September 2024. VIREB’s inventory of condo apartments was 390 in September, down from the 410 listings posted one year ago. There were 341 row/townhouses for sale last month compared to 335 in September 2024.
Read the full report on VIREB website!
The following data is a comparison between September 2025 and September 2024 numbers, and is current as of October of 2025. Click here to check out last month’s infographics.
You can also view all our VIREB infographics by clicking here.
Download Printable Version – September 2025 VIREB Market Report
INFOGRAPHICS: August 2025 VIREB Vancouver Island Market Reports

MARKET SLOWER THAN IN JULY BUT STILL AHEAD OF LAST YEAR
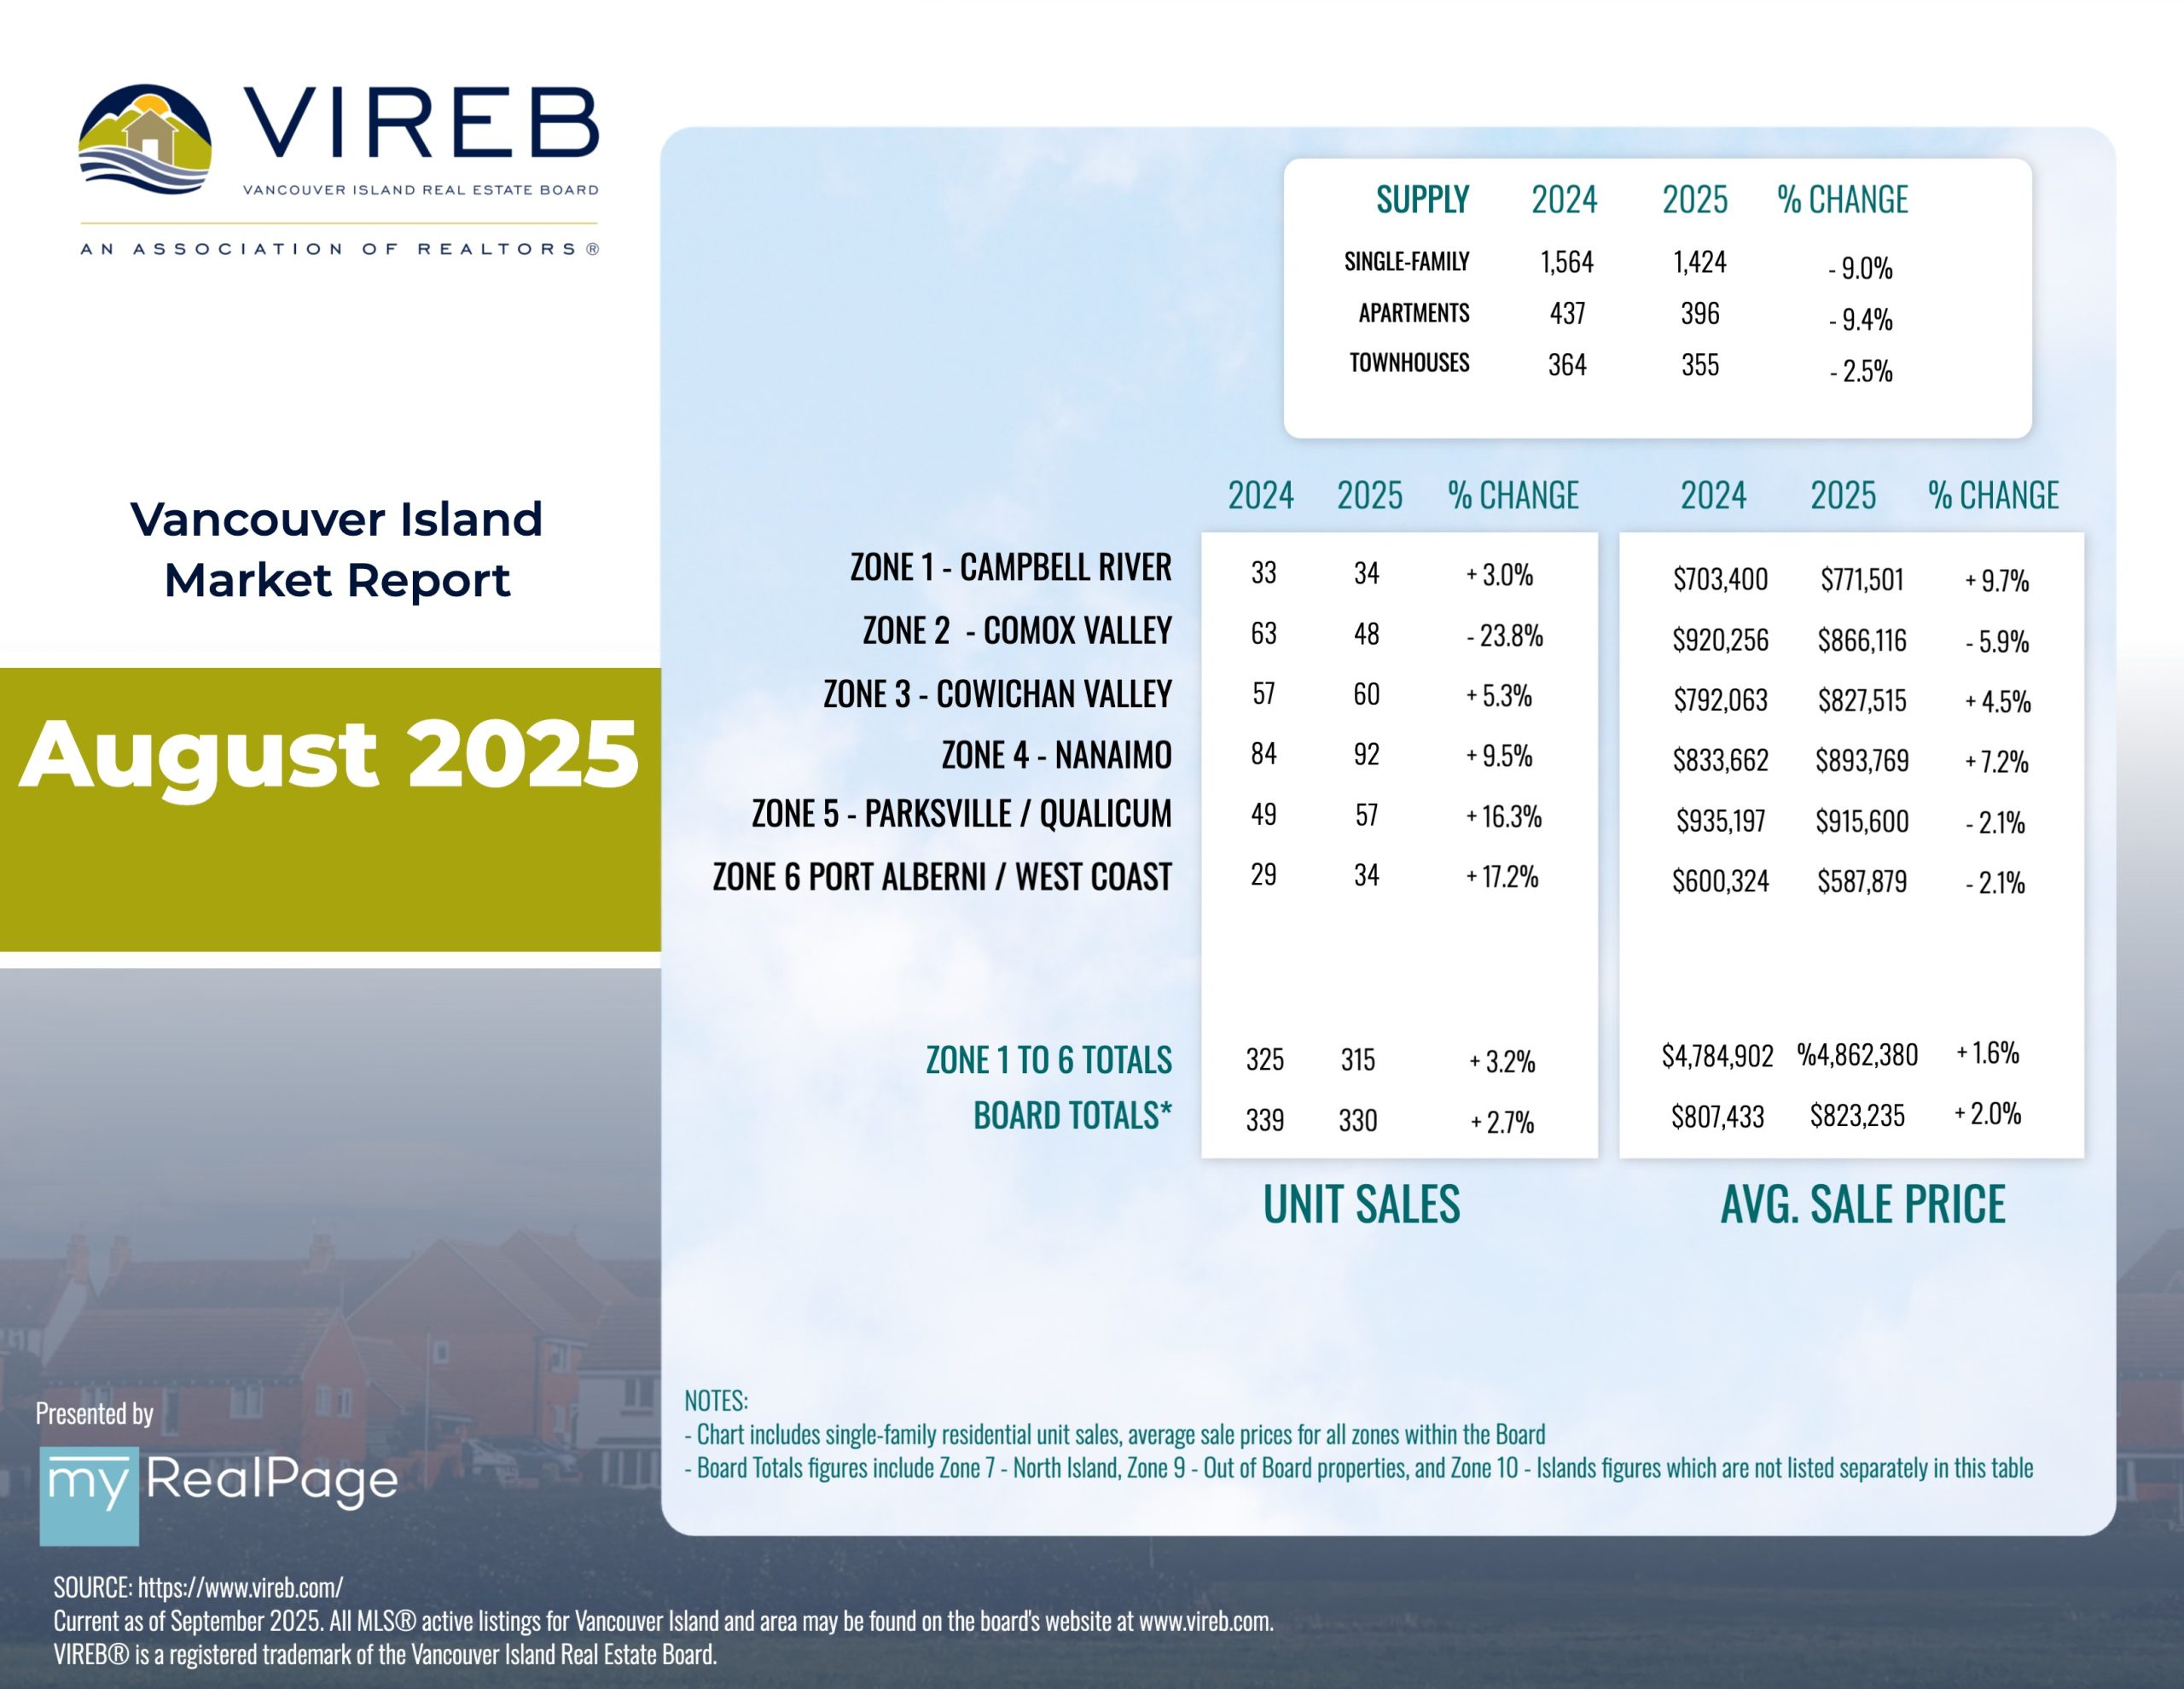
The Vancouver Island Real Estate Board (VIREB) recorded 692 unit sales (all property types) in August 2025, up six per cent from one year ago. Year-over-year active listings (all property types) were 4,405, down three per cent from the previous year.
In the single-family category (excluding acreage and waterfront), 339 homes sold in August, up three per cent from one year ago and down 19 per cent from July. Sales of condo apartments last month came in at 74, an increase of nine per cent year over year and up four per cent from July. In the row/townhouse category, 72 units changed hands in August, up four per cent from one year ago and down 24 per cent from July.
Active listings of single-family homes were 1,424 last month compared to 1,564 in August 2024. VIREB’s inventory of condo apartments was 396 in August, down from the 437 listings posted one year ago. There were 355 row/townhouses for sale last month compared to 364 in August 2024. VIREB Chair Olivier Naud notes that VIREB’s housing market is in the mid-range of balanced, with approximately six months of inventory.
“August was slower than July, but that’s typical with back to school on the horizon,” says Naud. “However, sales were up from the previous August, and our market is proving to be resilient. There is pent-up demand but still some hesitancy that we attribute to ongoing tariff concerns.”
Read the full report on VIREB website!
The following data is a comparison between August 2025 and August 2024 numbers, and is current as of September of 2025. Click here to check out last month’s infographics.
You can also view all our VIREB infographics by clicking here.
Download Printable Version – August 2025 VIREB Market Report
INFOGRAPHICS: July 2025 VIREB Vancouver Island Market Reports

HOUSING MARKET WEATHERING ECONOMIC CROSSWINDS
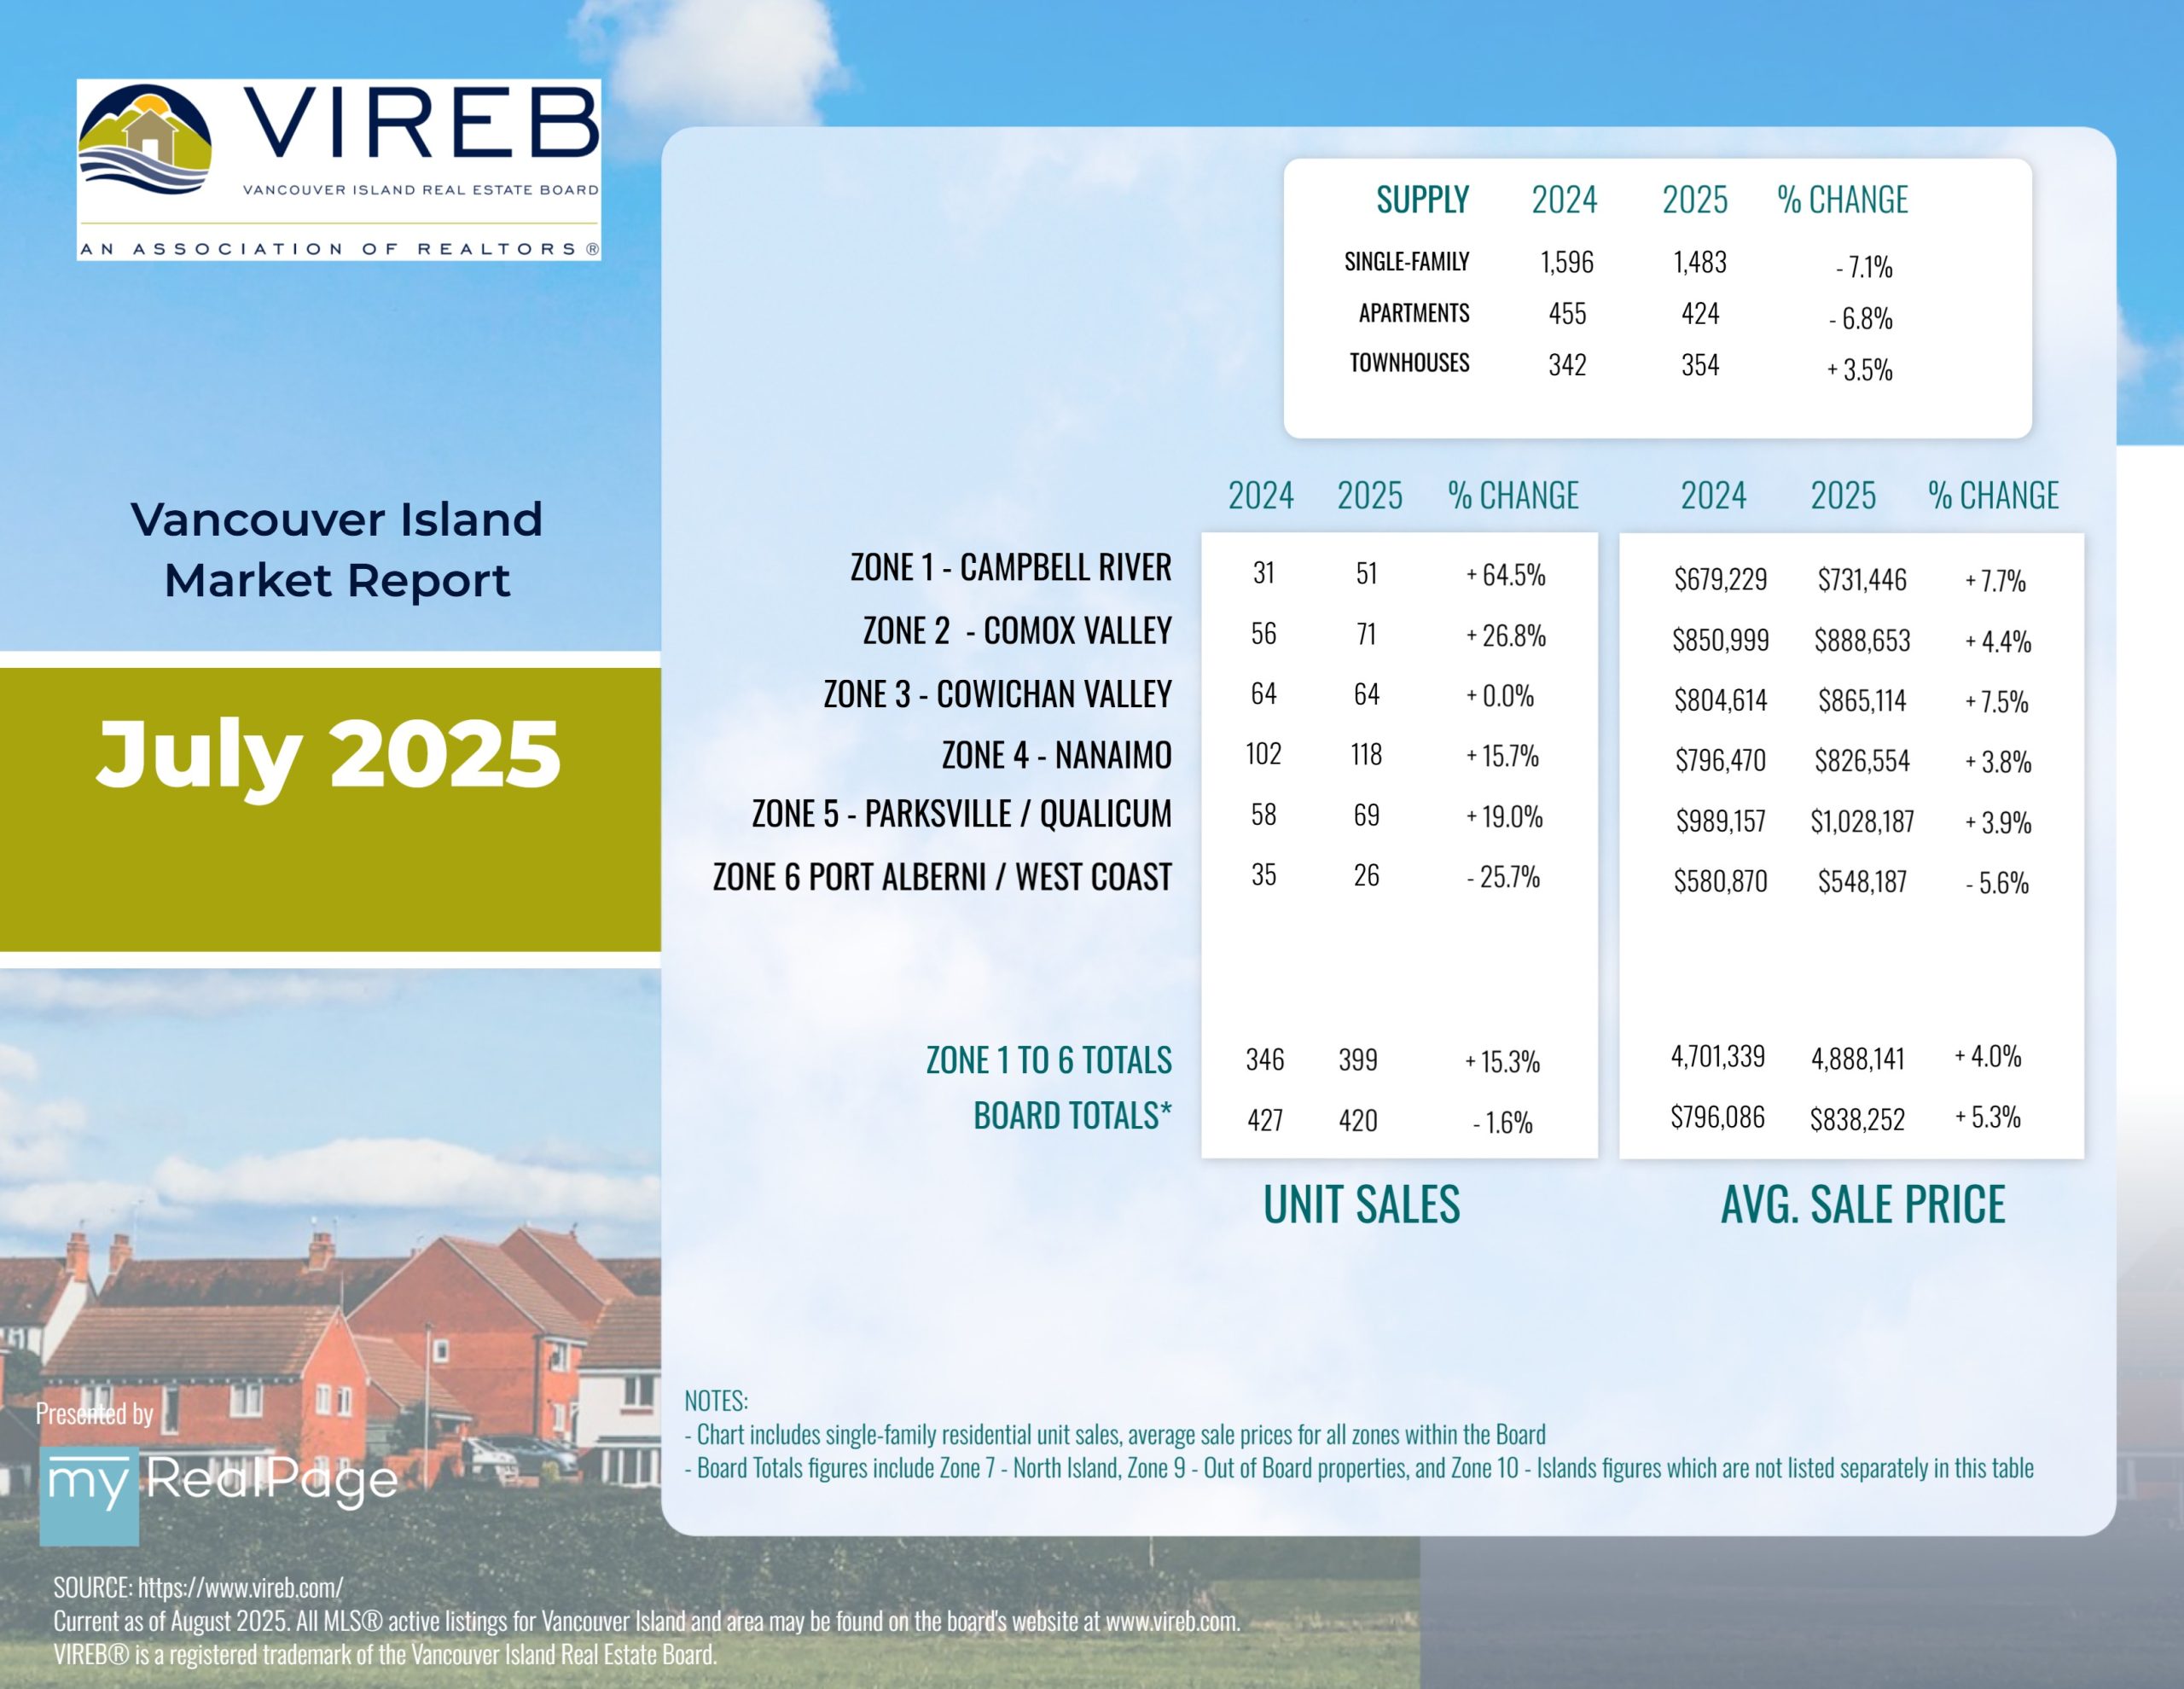
The Vancouver Island Real Estate Board (VIREB) recorded 806 unit sales (all property types) in July 2025, up 10 per cent from one year ago. Year-over-year active listings (all property types) were 4,512, up one per cent from the previous year.
In the single-family category (excluding acreage and waterfront), 420 homes sold in July, up 16 per cent from one year ago and down 11 per cent from June. Sales of condo apartments last month came in at 71, a decrease of 17 per cent year over year and down eight per cent from June. In the row/townhouse category, 95 units changed hands in July, down three per cent from one year ago and an increase of two per cent from June.
Active listings of single-family homes were 1,483 last month compared to 1,596 in July 2024. VIREB’s inventory of condo apartments was 424 in July, down from the 455 listings posted one year ago. There were 354 row/townhouses for sale last month compared to 342 in July 2024.
Read the full report on VIREB website!
The following data is a comparison between July 2025 and July 2024 numbers, and is current as of August of 2025. Click here to check out last month’s infographics.
You can also view all our VIREB infographics by clicking here.
Download Printable Version – July 2025 VIREB Market Report
INFOGRAPHICS: June 2025 VIREB Vancouver Island Market Reports

HOUSING MARKET WEATHERING UNCERTAINTY AS SUMMER UNFOLDS
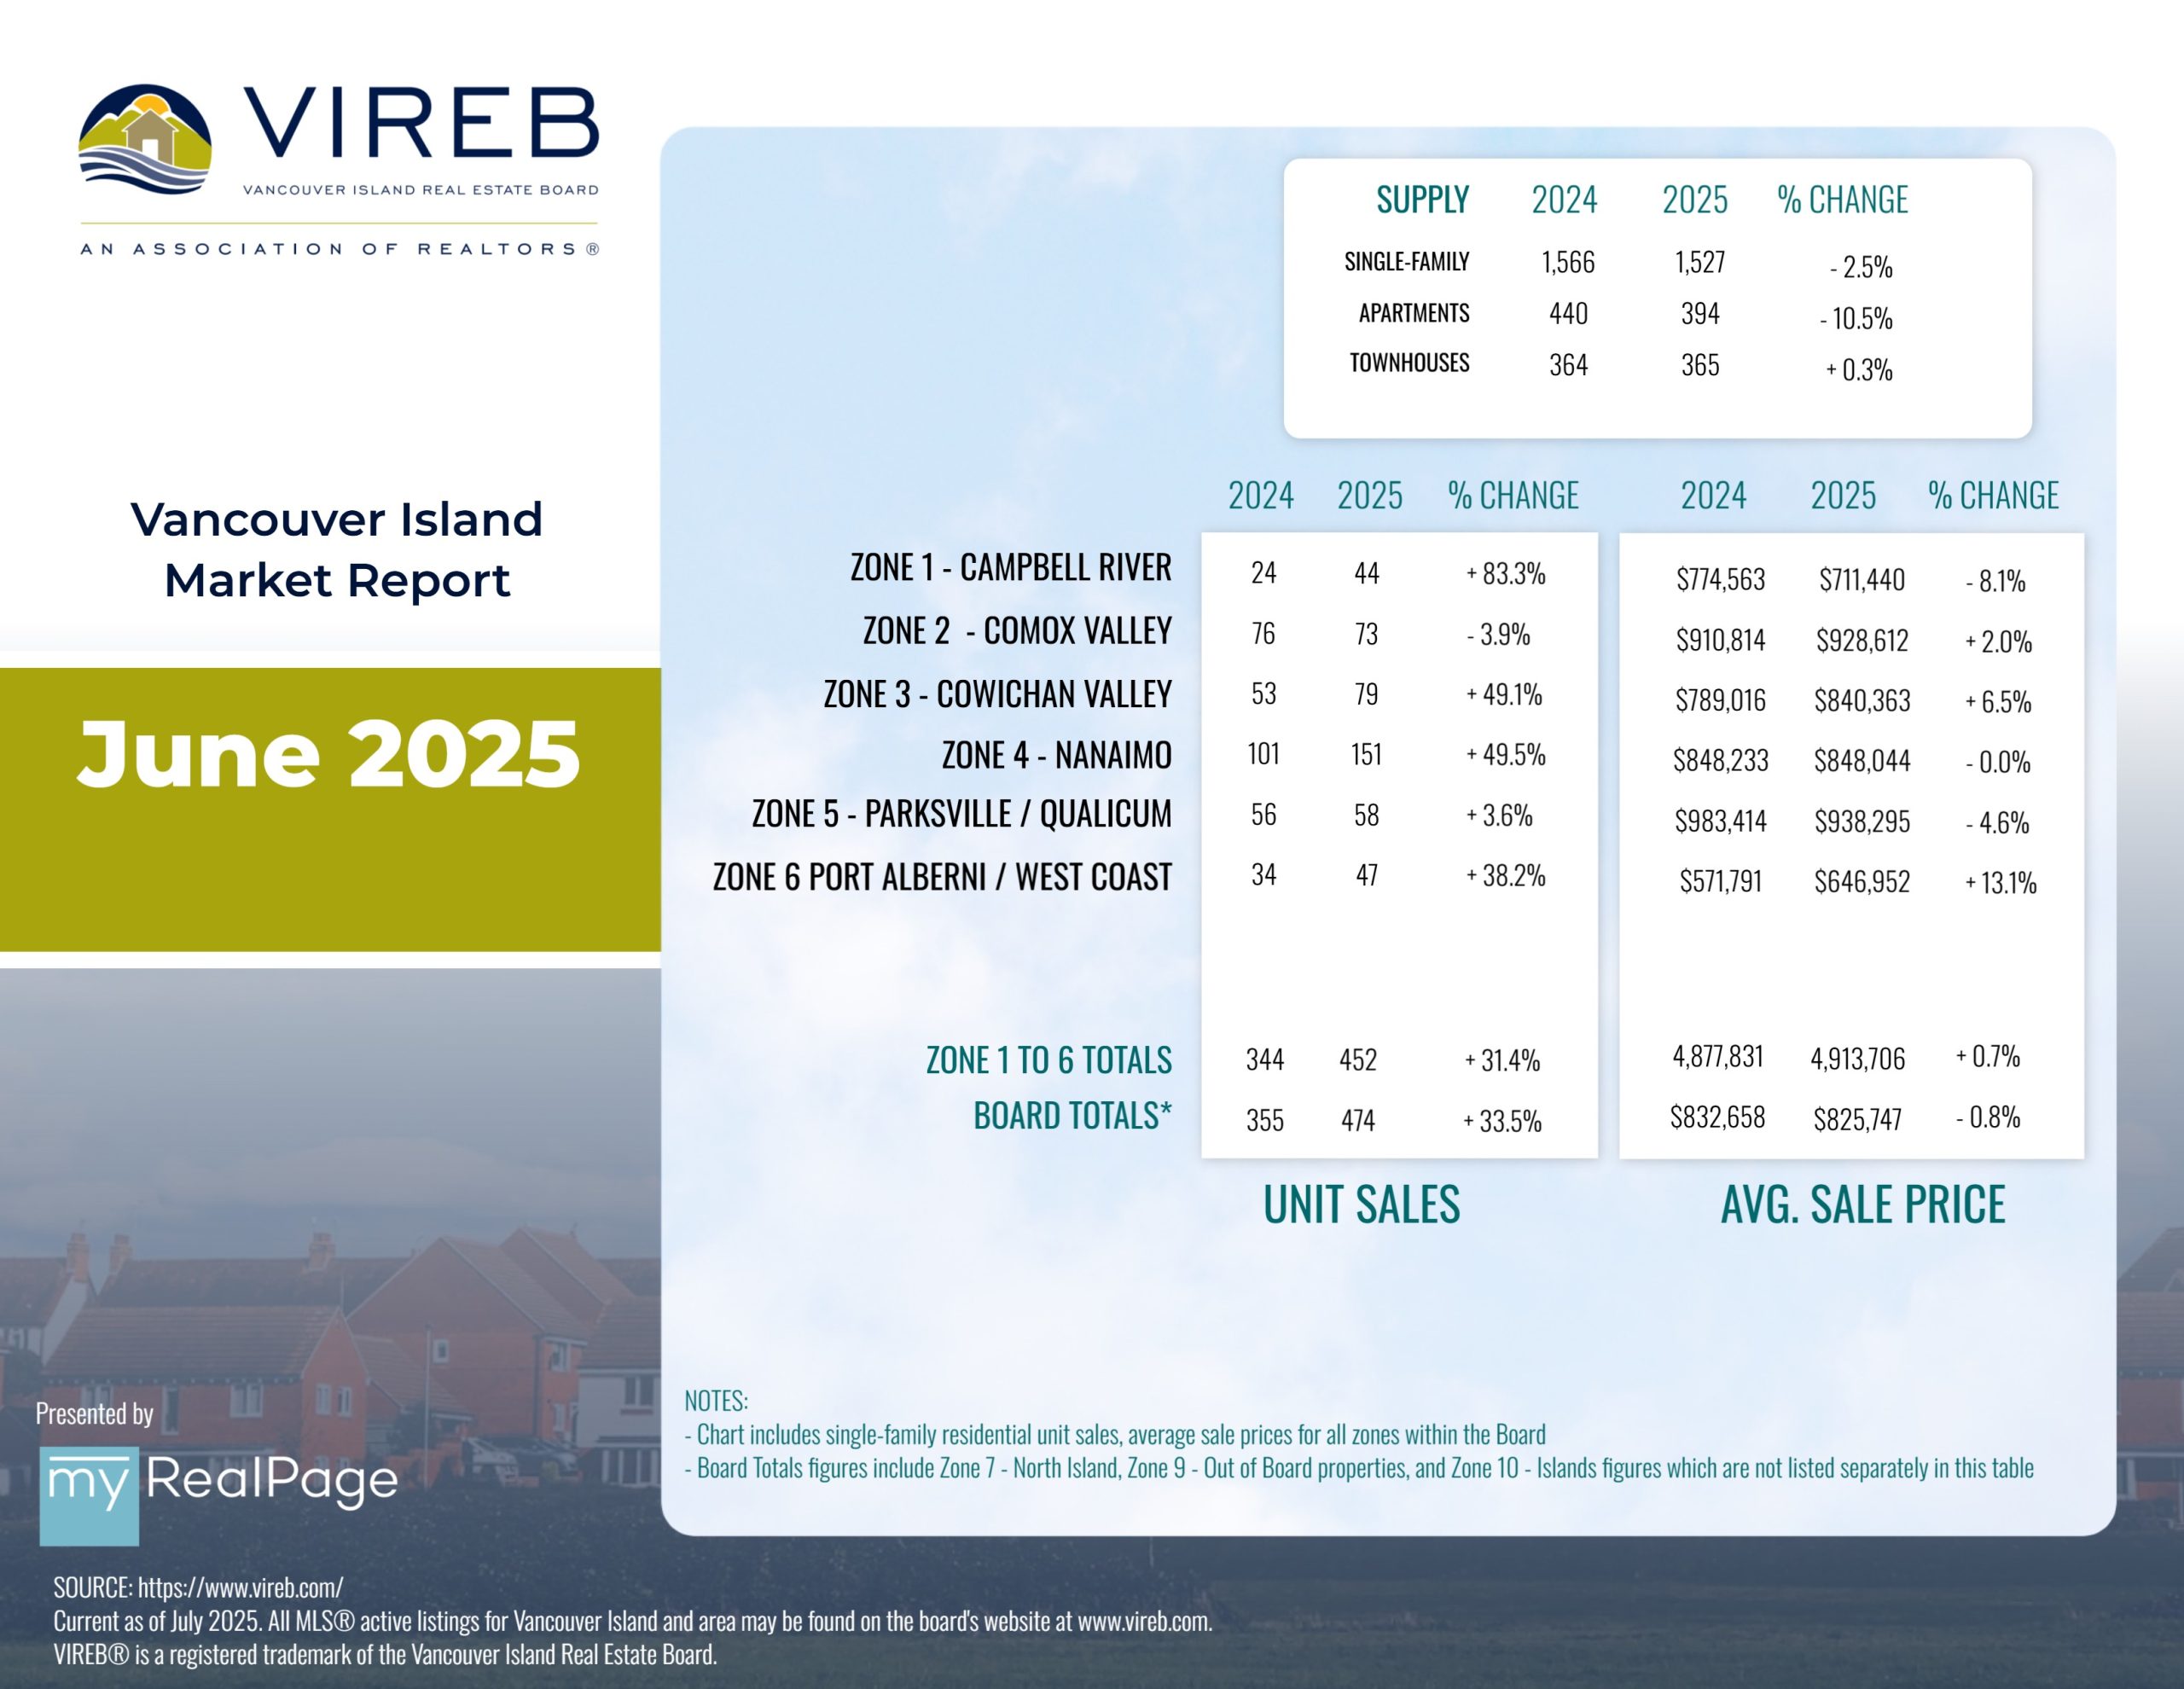
The Vancouver Island Real Estate Board (VIREB) recorded 858 unit sales (all property types) in June 2025, up 18 per cent from one year ago. Year-over-year active listings (all property types) were 4,542, up one per cent from the previous year.
In the single-family category (excluding acreage and waterfront), 474 homes sold in June, up 34 per cent from one year ago and an increase of 16 per cent from May. Sales of condo apartments last month came in at 77, a decrease of six per cent year over year and up four per cent from May. In the row/townhouse category, 93 units changed hands in June, up two per cent from one yearago and an increase of eight per cent from May.
Active listings of single-family homes were 1,527 last month compared to 1,566 in June 2024.VIREB’s inventory of condo apartments was 394 in June, down from the 440 listings posted one year ago. There were 365 row/townhouses for sale last month compared to 364 in June 2024.
Read the full report on VIREB website!
The following data is a comparison between June 2025 and June 2024 numbers, and is current as of July of 2025. Click here to check out last month’s infographics.
You can also view all our VIREB infographics by clicking here.
Download Printable Version – June 2025 VIREB Market Report
INFOGRAPHICS: May 2025 VIREB Vancouver Island Market Reports

BUYER OPTIMISM AND A BALANCED MARKET TREND IN MAY
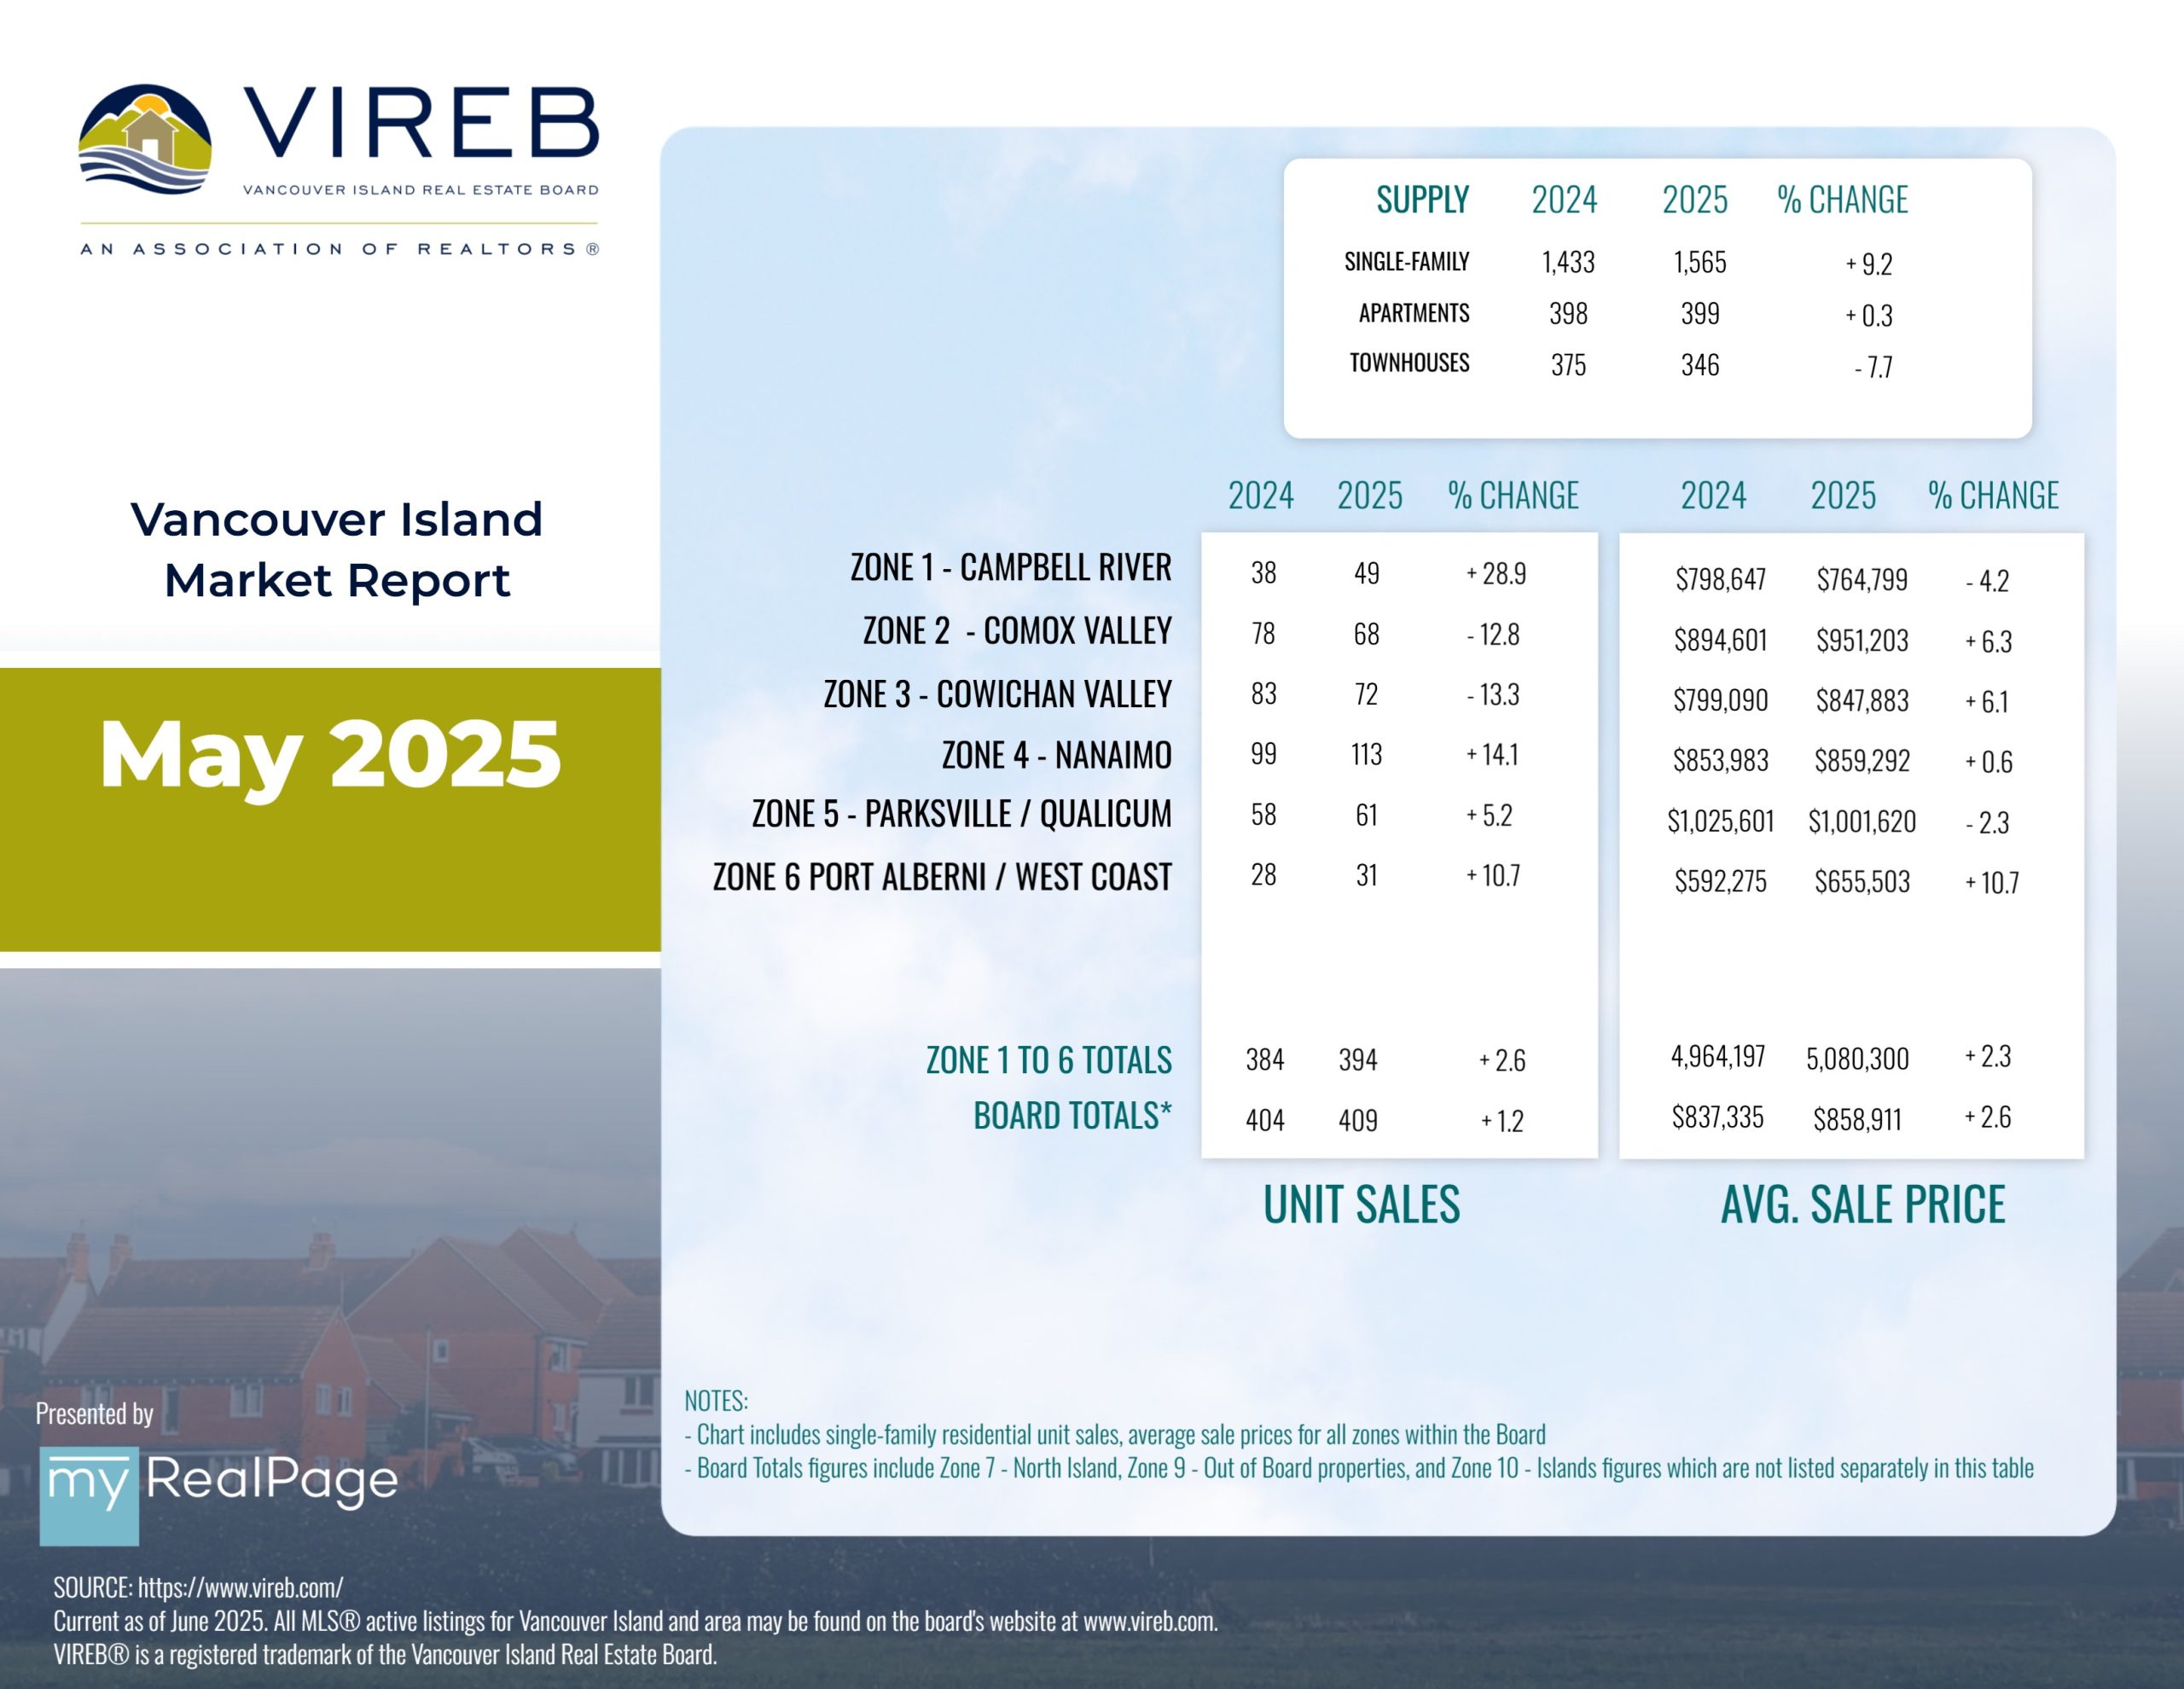
TThe Vancouver Island Real Estate Board (VIREB) recorded 781 unit sales (all property types) in May 2025, down three per cent from one year ago. Year-over-year active listings (all property types) rose by five per cent, climbing to 4,439 from 4,242 the previous May.
In the single-family category (excluding acreage and waterfront), 409 homes sold in May, up one per cent from one year ago and an increase of two per cent from April. Sales of condo apartments last month came in at 74, a decrease of 19 per cent year over year and down 24 per cent from April.
In the row/townhouse category, 86 units changed hands in May, down 20 per cent from one year ago and a decrease of four per cent from April. Active listings of single-family homes were 1,565 last month compared to 1,433 in May 2024. VIREB’s inventory of condo apartments was 399 in May, one more than the 398 posted one year ago. There were 346 row/townhouses for sale last month compared to 375 in May 2024.
Read the full report on VIREB website!
The following data is a comparison between May 2025 and May 2024 numbers, and is current as of June of 2025. Click here to check out last month’s infographics.
You can also view all our VIREB infographics by clicking here.
Download Printable Version – May 2025 VIREB Market Report
INFOGRAPHICS: April 2025 VIREB Vancouver Island Market Reports

HOUSING MARKET HOLDING STEADY DESPITE UNCERTAINTY
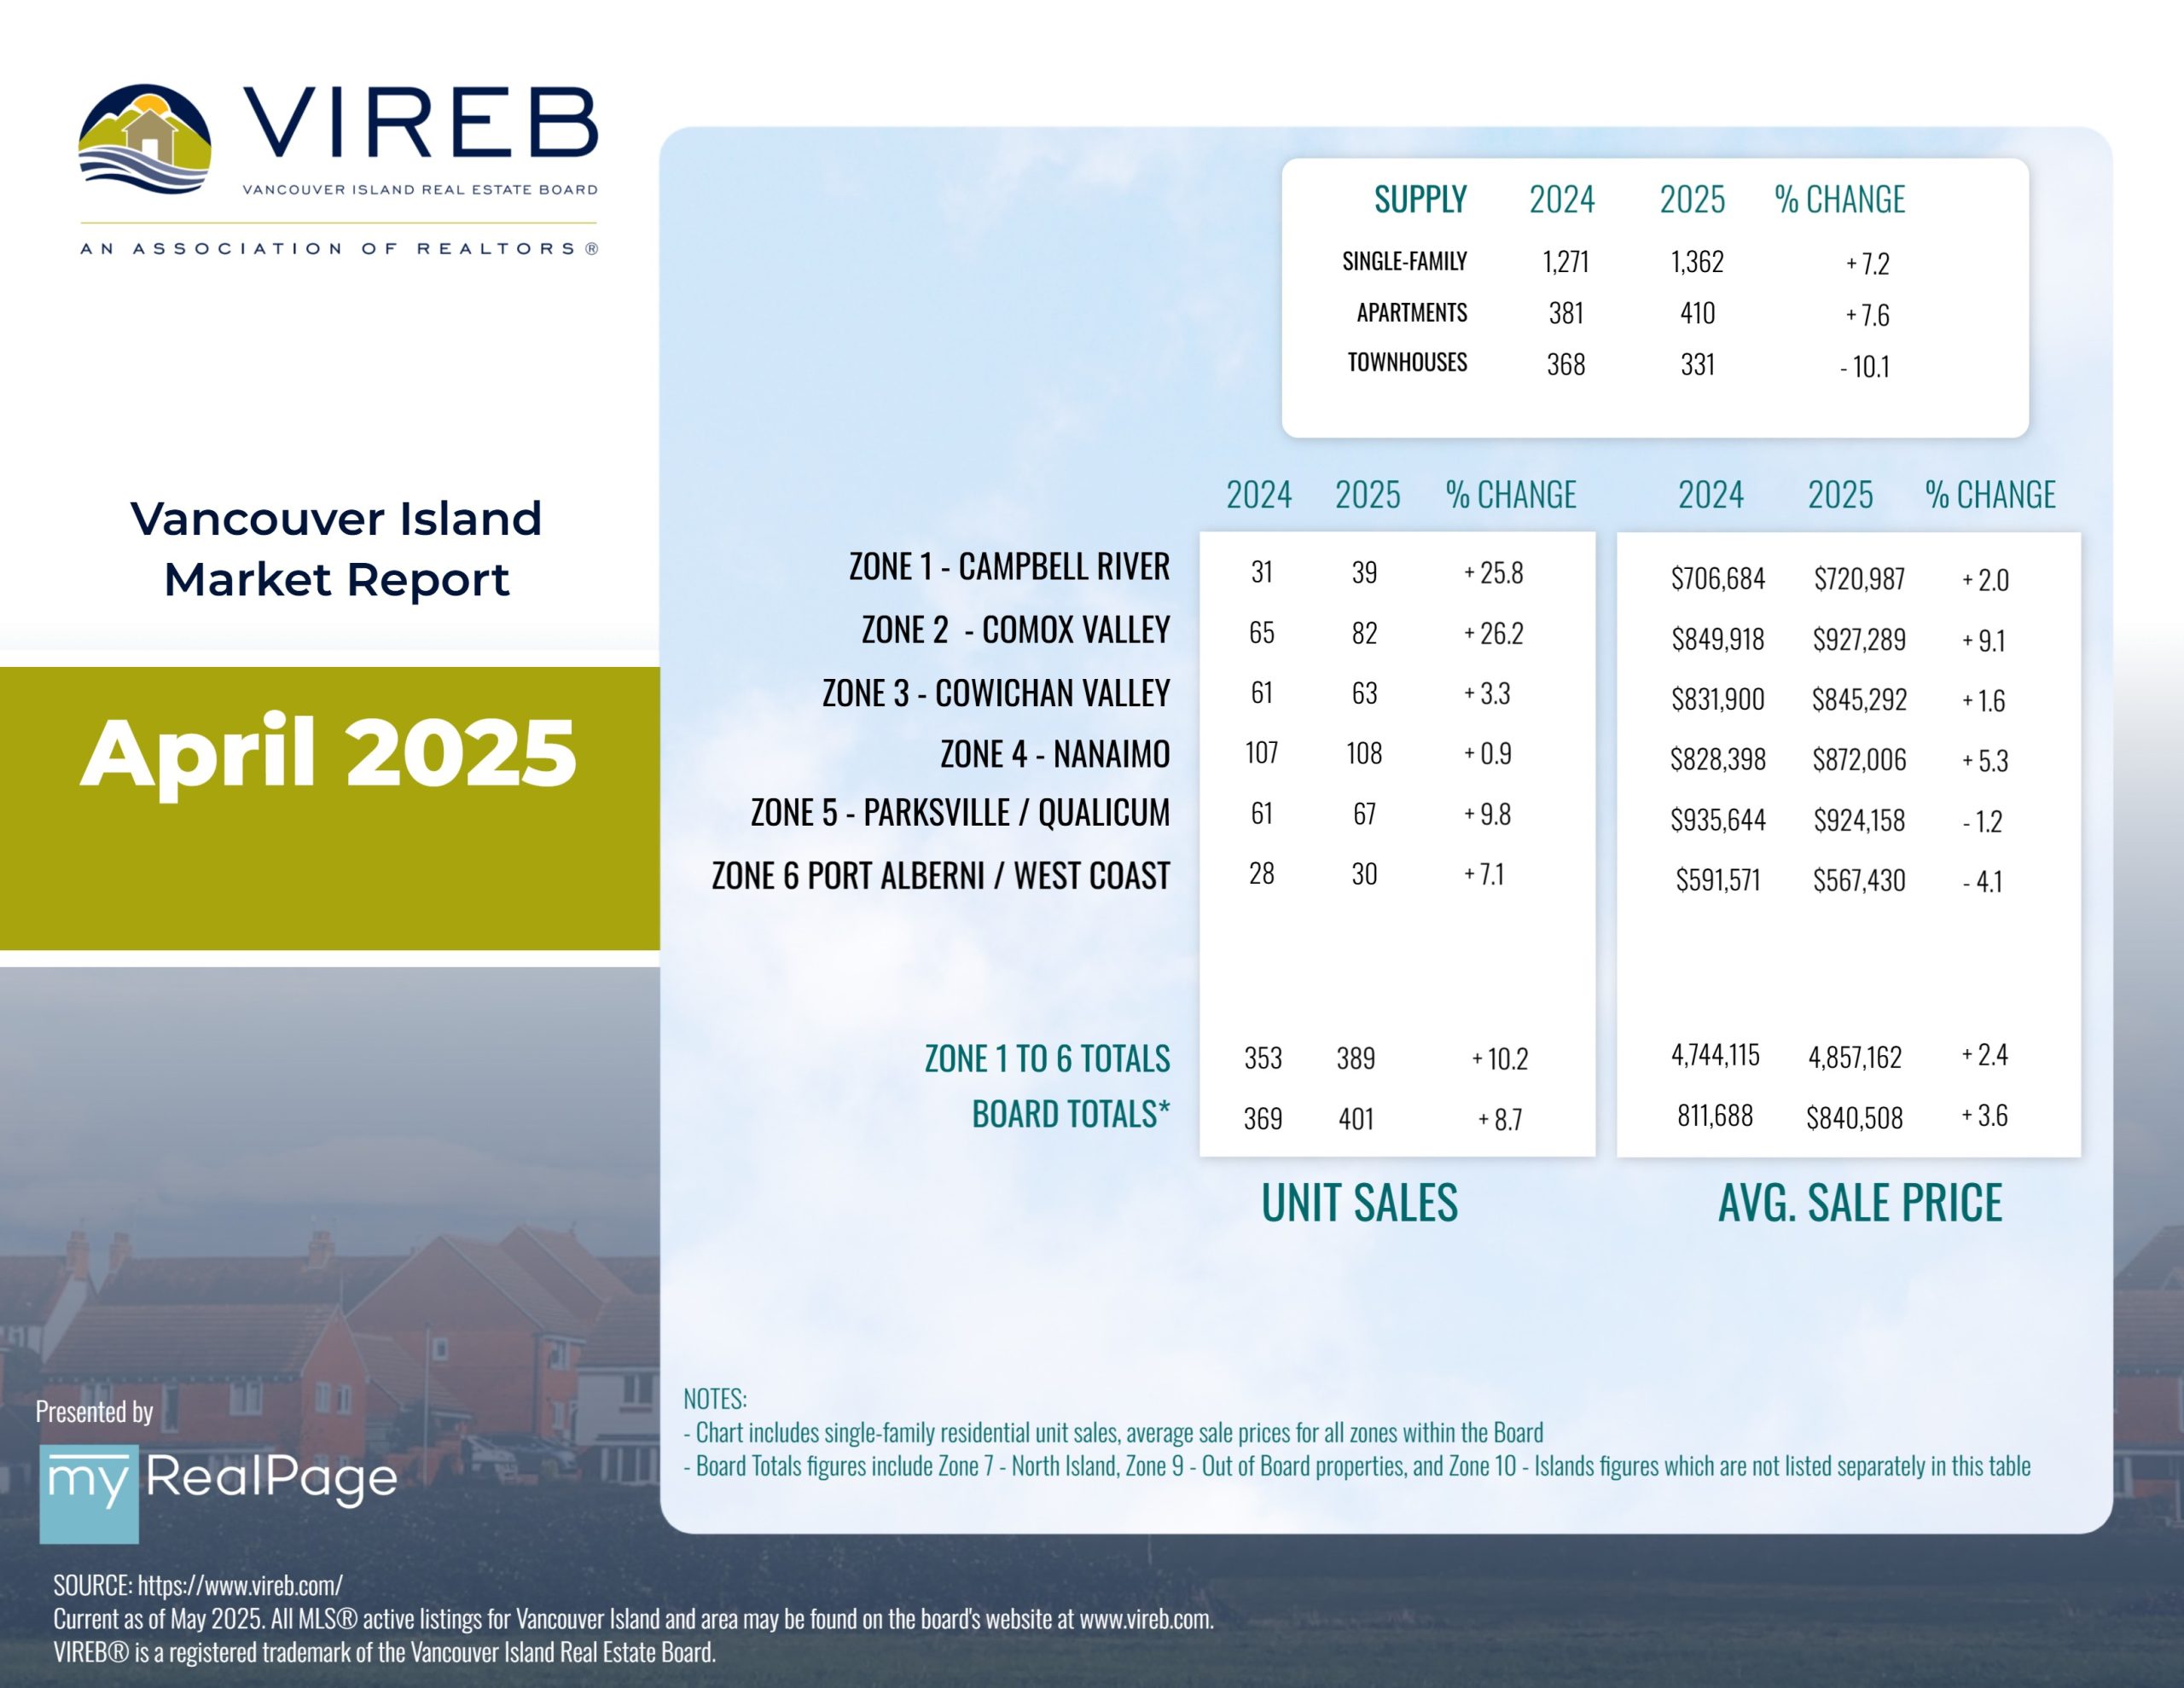
The Vancouver Island Real Estate Board (VIREB) recorded 786 unit sales (all property types) in April 2025, up eight per cent from one year ago. Year-over-year active listings (all property types) rose by four per cent, climbing to 4,080 from 3,913 the previous April.
In the single-family category (excluding acreage and waterfront), 401 homes sold in April, up nine per cent from one year ago and an increase of 33 per cent from March. Sales of condo apartments month came in at 97, an increase of 33 per cent year over year and up 12 per cent from March. In the row/townhouse category, 90 units changed hands in April, up eight per cent from one year ago and 21 per cent from March.
Active listings of single-family homes were 1,362 last month compared to 1,271 in April 2024. VIREB’s inventory of condo apartments was 410 in April, up from the 381 posted one year ago. There were 331 row/townhouses for sale last month compared to 368 in April 2024.
Read the full report on VIREB website!
The following data is a comparison between April 2025 and April 2024 numbers, and is current as of May of 2025. Click here to check out last month’s infographics.
You can also view all our VIREB infographics by clicking here.
Download Printable Version – April 2025 VIREB Market Report
INFOGRAPHICS: March 2025 VIREB Vancouver Island Market Reports

MARKET HOLDING STEADY IN BALANCED TERRITORY
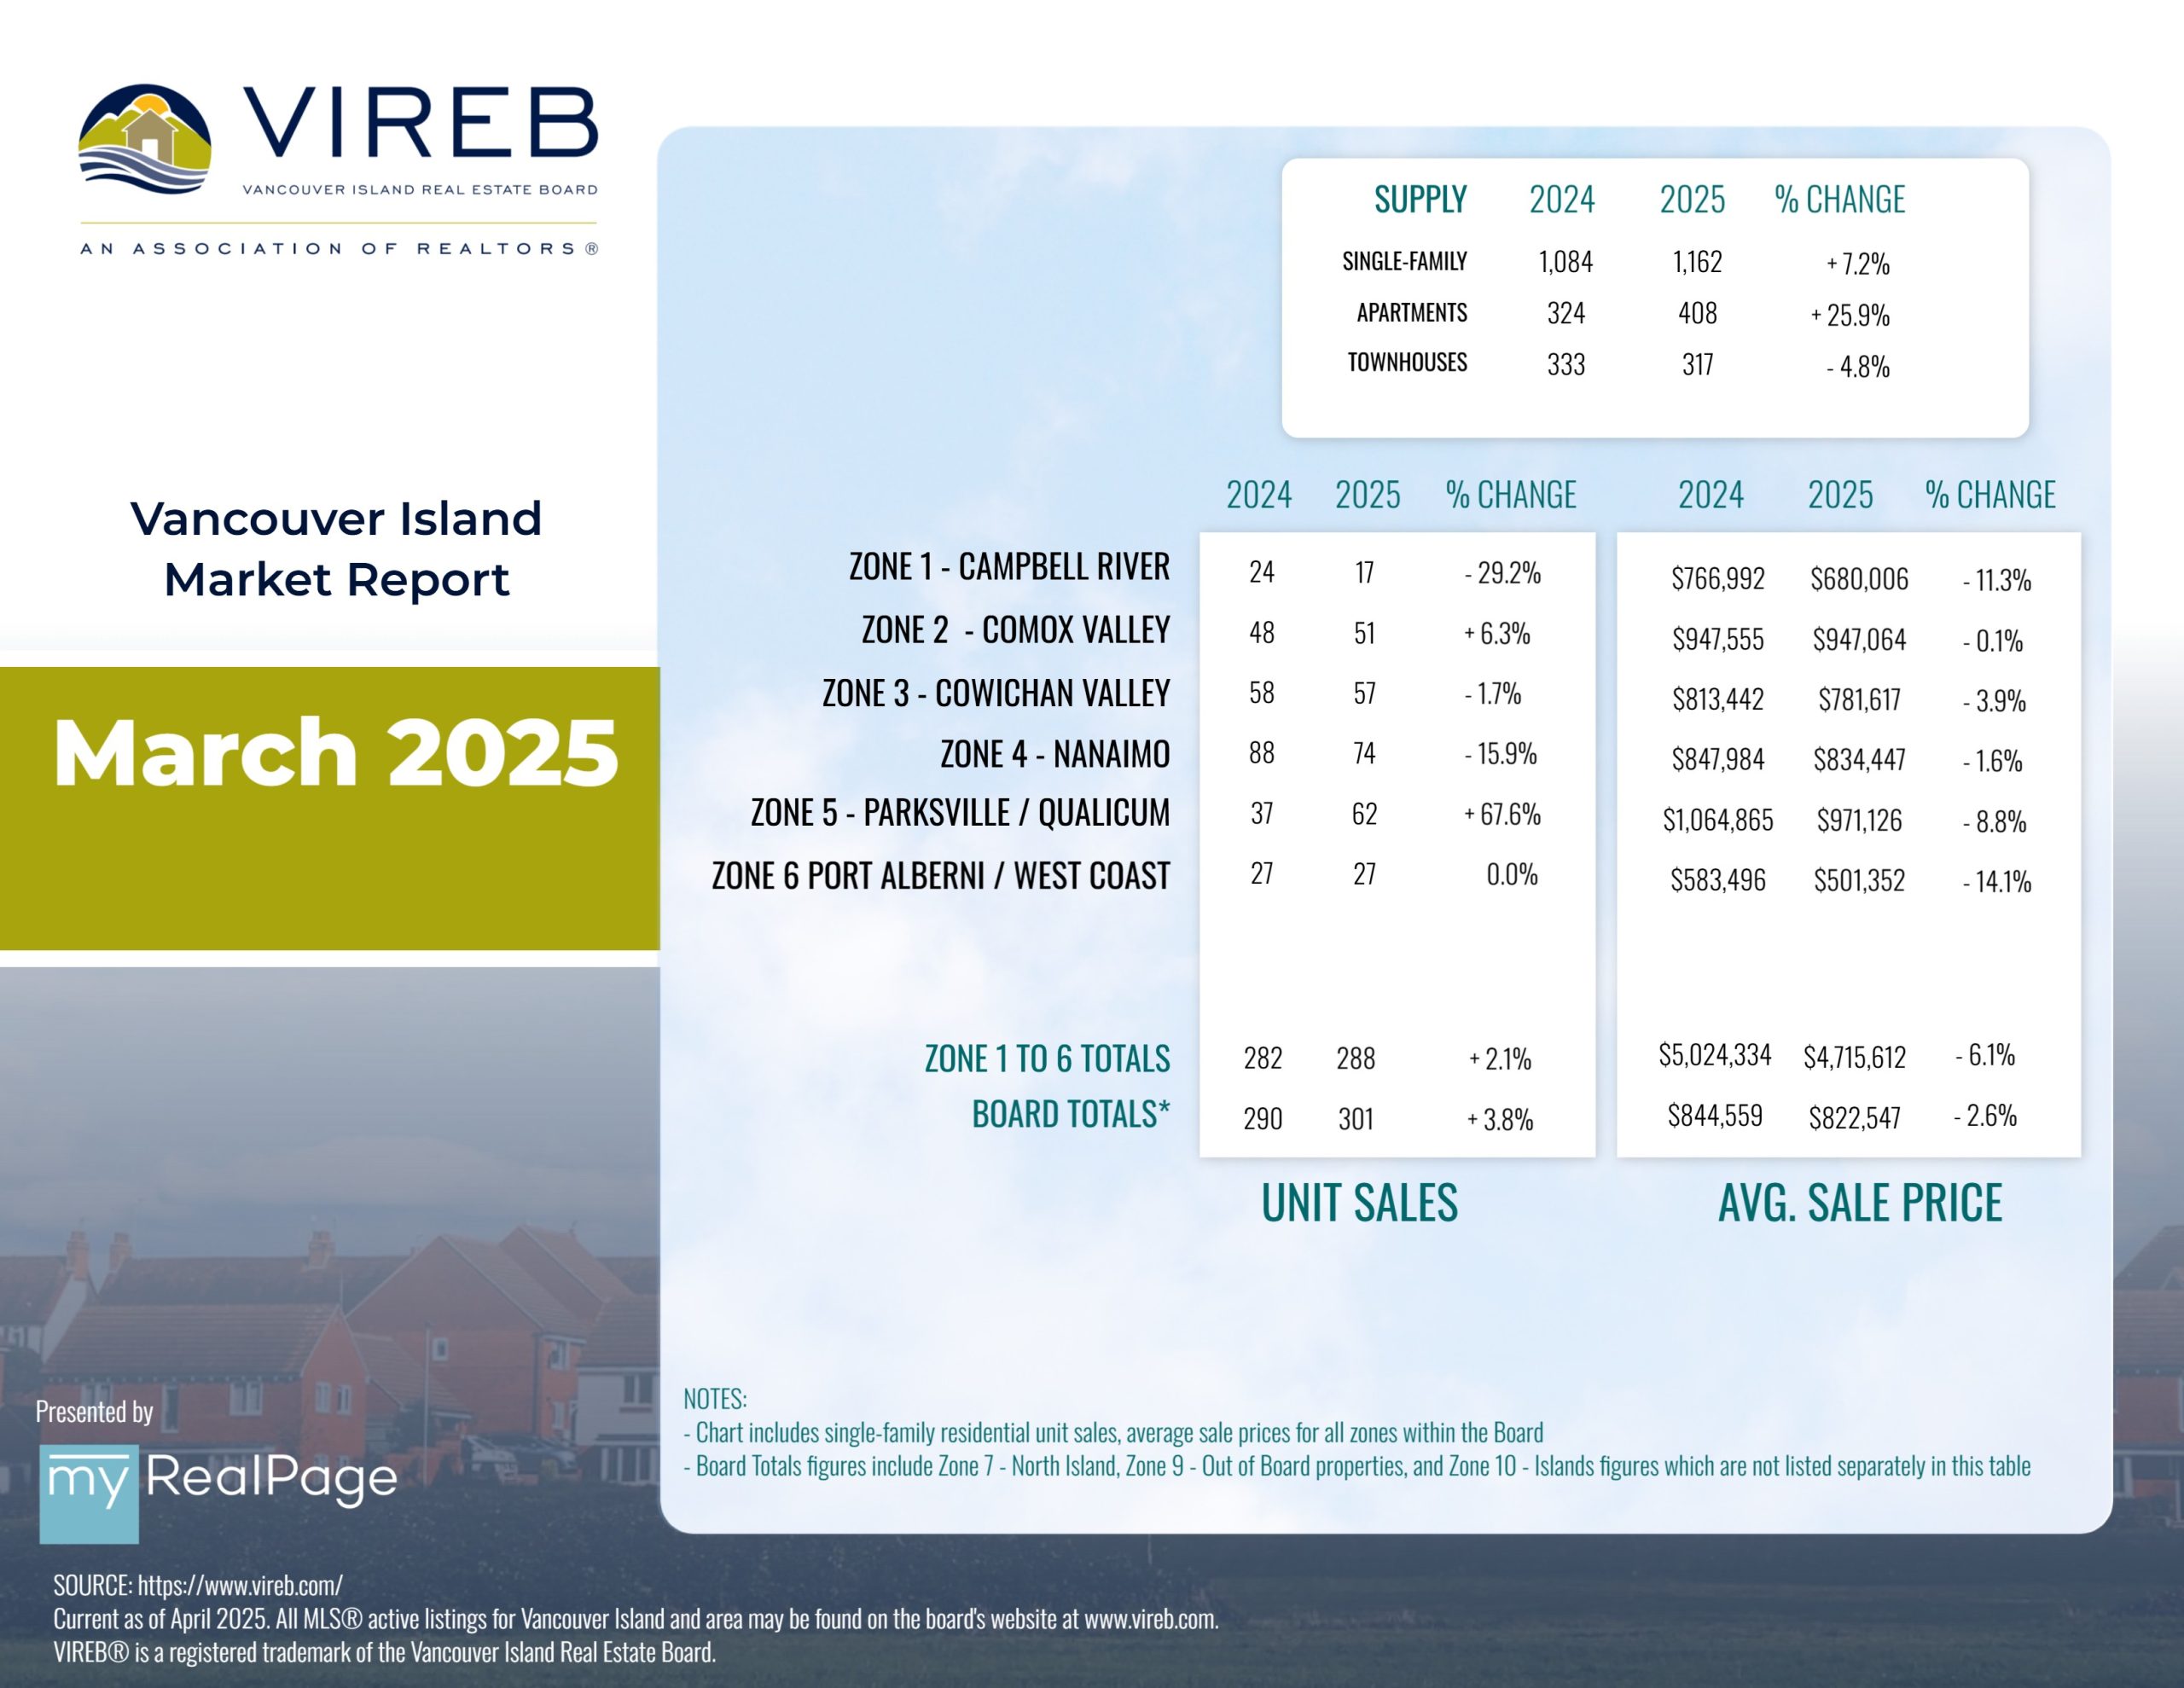
The Vancouver Island Real Estate Board (VIREB) recorded 637 unit sales (all property types) in March 2025, down one per cent from one year ago. Year-over-year active listings (all property types) rose by six per cent, climbing to 3,708 from 3,488 the previous March.
In the single-family category (excluding acreage and waterfront), 301 homes sold in March, up four per cent from one year ago and an increase of 26 per cent from February. Sales of condo apartments last month came in at 87, an increase of nine per cent year over year and up 45 per cent from February. In the row/townhouse category, 74 units changed hands in March, down nine per cent from one year ago and up by 21 per cent over February.
Active listings of single-family homes were 1,162 last month compared to 1,084 in March 2024. VIREB’s inventory of condo apartments was 408 in March, up from the 324 posted one year ago. There were 317 row/townhouses for sale last month compared to 333 the previous year.
Read the full report on VIREB website!
The following data is a comparison between March 2025 and March 2024 numbers, and is current as of April of 2025. Click here to check out last month’s infographics.
You can also view all our VIREB infographics by clicking here.
Download Printable Version – March 2025 VIREB Market Report
INFOGRAPHICS: February 2025 VIREB Vancouver Island Market Reports

UNCERTAINTY SURROUNDING TARIFFS HOLDING BACK BUYERS
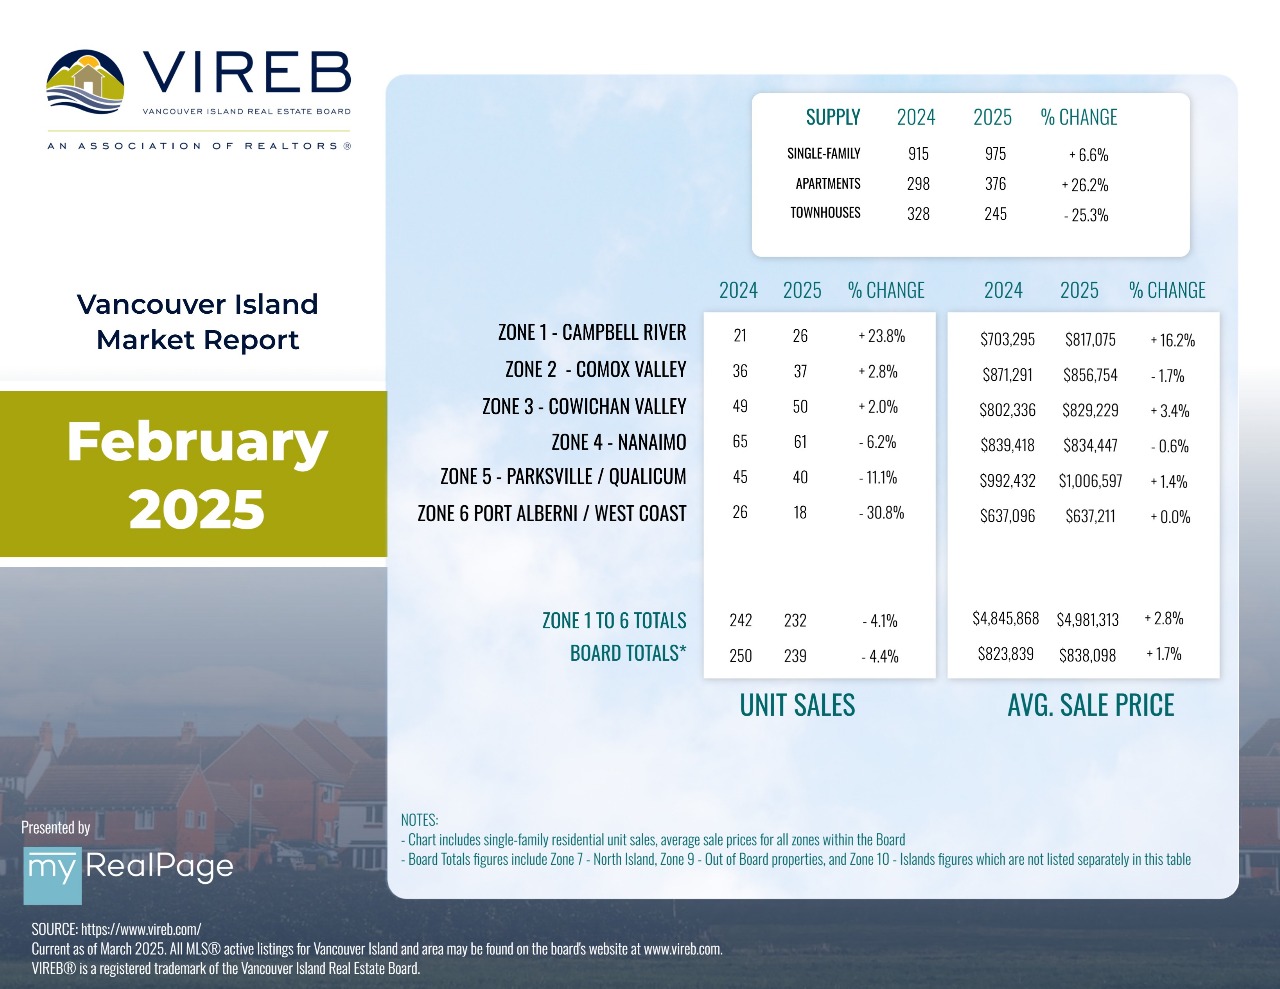
The Vancouver Island Real Estate Board (VIREB) recorded 493 unit sales (all property types) in February 2025, the same as one year ago. Year-over-year active listings (all property types) rose by three per cent, climbing to 3,235 from 3,153 in February 2024.
In the single-family category (excluding acreage and waterfront), 239 homes sold in February, down four per cent from one year ago and up 17 per cent from the previous month. Sales of condo apartments last month came in at 60, an increase of 12 per cent year over year and up 30 per cent from January. In the row/townhouse category, 61 units changed hands in February, up five per cent from one year ago and increasing by 42 per cent over January.
Active listings of single-family homes were 975 last month, up from the 915 posted one year ago. VIREB’s inventory of condo apartments was 376 last month compared to 298 in February 2024. There were 245 row/townhouses for sale last month compared to 328 the previous year.
Read the full report on VIREB website!
The following data is a comparison between February 2025 and February 2024 numbers, and is current as of March of 2025. Click here to check out last month’s infographics.
You can also view all our VIREB infographics by clicking here.
Download Printable Version – February 2025 VIREB Market Report
MLS® property information is provided under copyright© by the Vancouver Island Real Estate Board and Victoria Real Estate Board. The information is from sources deemed reliable, but should not be relied upon without independent verification.
©Copyright 2023 Cheryl Barnes. All rights reserved. | Privacy Policy | Powered by myRealPage
